Peer Reviewed
Misinformation interventions are common, divisive, and poorly understood
Article Metrics
26
CrossRef Citations
PDF Downloads
Page Views
Social media platforms label, remove, or otherwise intervene on thousands of posts containing misleading or inaccurate information every day. Who encounters these interventions, and how do they react? A demographically representative survey of 1,207 Americans reveals that 49% have been exposed to some form of online misinformation intervention. However, most are not well-informed about what kinds of systems, both algorithmic and human, are applying these interventions: 40% believe that content is mostly or all checked, and 17.5% are not sure, with errors attributed to biased judgment more than any other cause, across political parties. Although support for interventions differs considerably by political party, other distinct traits predict support, including trust in institutions, frequent social media usage, and exposure to “appropriate” interventions.
Research Questions
- How does the public experience and interpret current misinformation interventions on social media (e.g., downranking, removal, labels)?
- Are certain types of interventions or sources of interventions more popular than others?
- How strongly do different traits (e.g., political party affiliation, trust in institutions) predict how people feel about these misinformation interventions?
- How do online experiences (e.g., frequency of social media usage, intervention exposure) correlate with support for misinformation interventions?
Essay Summary
- In this article, we describe a representative sample of the American public’s attitudes towards and experiences with online platform responses to misinformation, or “interventions.” We use data from an online opt-in survey with 1,207 respondents administered in March 2021 and recruited from the Lucid survey marketplace. Respondents were quota-matched on gender, age, and income according to the 2018 Current Population Survey.
- We pre-registered hypotheses connecting attitudes toward misinformation interventions with traits such as partisanship, institutional trust, media preferences, and intervention experience. We selected these traits based on prior qualitative research that identified them as associated with attitudes towards interventions (Saltz et al., 2021). We conducted a survey in order to examine broader nationally representative attitudes than can be afforded by qualitative research or is available with platform behavioral data.
- We find that encounters with platform misinformation interventions are widespread (49% overall report some exposure occurring after the 2020 election), but the process for reviewing content on platforms is poorly understood (40% believe most or all content on online platforms is fact-checked, 17% are unsure). Interventions trigger polarized responses between Republicans and Democrats (roughly a standard deviation gap).
- Besides partisanship, we surface several additional traits that correlate strongly with intervention attitudes. Trust in institutions (though not any particular institution) strongly predicts support for different intervention types and intervention sources (though not any particular source). Moreover, positive experiences with misinformation interventions predict increased intervention support from both Democrats and Republicans, suggesting that, in some cases, perceived intervention efficacy and reduction of false positives may help to overcome disapproving attitudes.
- Our main contribution is a detailed description of American public opinion on misinformation interventions that can be used to develop more effective interventions. In particular, we discuss how four elements can be incorporated into the design of misinformation interventions: explainability, transparency, oversight, and trust.
Implications
Are social media platforms not doing enough to address misinformation, or are they doing too much? In the United States, a common narrative suggests that partisanship is the sole driver of public opinion about this question, with Republicans opposing misinformation interventions, attributing bias in those evaluating content and Democrats supporting interventions, viewing Republican claims of bias as unfounded (Owen, 2020). Ultimately, the answer depends on how one defines and classifies misinformation and evaluates its impacts.
In this article, we approach “misinformation” as an umbrella term encompassing definitions based on the Information Disorder framework (Wardle et al., 2018) that includes both misinformation, the inadvertent sharing of false information, as well as disinformation, the deliberate creation and sharing of information known to be false. The scale of the misinformation problem is highly contested and dependent on how misinformation is classified (Rogers, 2020). Beyond this, not every type of online platform response to misinformation, or intervention, is equally severe. Some, like removal, prevent access entirely, raising free speech concerns, whereas downranking makes access more difficult by reducing reach. Other “soft moderation” interventions such as credibility and contextual labels allow both free speech and reach, yet may still provoke mocking and resistance from users (Zannettou, 2021).
The research on the effects of these various approaches on users is mixed. Some studies have found that adding labels can be effective at reducing intentions to share that content for people across the political spectrum (Yaqub et al., 2020; Mena, 2020). Others have found little or no effects of labels on perceived accuracy of individual posts (Oeldorf-Hirsch et al., 2020) or engagement with those posts, for example in the form of likes and critical commentary (Bradshaw et al., 2021). Pennycook and colleagues (2020) additionally observed that, even if labeling is effective in reducing perceived accuracy of false headlines, the practice of labeling only a subset of content on platforms may result in an “implied truth effect” where false headlines that are not labeled are more likely to be perceived as accurate. As a whole, these experiments suggest that the specific content and system of labeling can have profound differences in the impact on users: for example, Pennycook and colleagues (2021) found that, in contrast to labeling the veracity of specific headlines, users shared higher quality news when content was labeled to shift user attention to accuracy in general.
Less is known in scholarly research about the user effects and perceptions of removal and downranking interventions. However, studies such as a 2020 survey of sex workers, activists, organizers, and protesters suggests that many directly experienced undesired “shadowbanning” and removal of posts and keywords related to their accounts, with 80.95% of respondents noticing a trend of suppression of information on social media (Blunt et al., 2020).
Building on this literature, we sought to understand, regardless of an intervention’s intended effects: how often the public experiences platform misinformation interventions (credibility labels in particular) and how characteristics (including but not limited to partisanship) predict attitudes toward a variety of common interventions such as labels, removals and downranking content (Table 1).1Note that while “intervention” may also refer to other efforts such as media literacy education, this article focuses specifically on interventions actively used during recent high stakes events, in the U.S. including the COVID-19 pandemic and the 2020 U.S. Presidential Election.
| Type | Definition | Example |
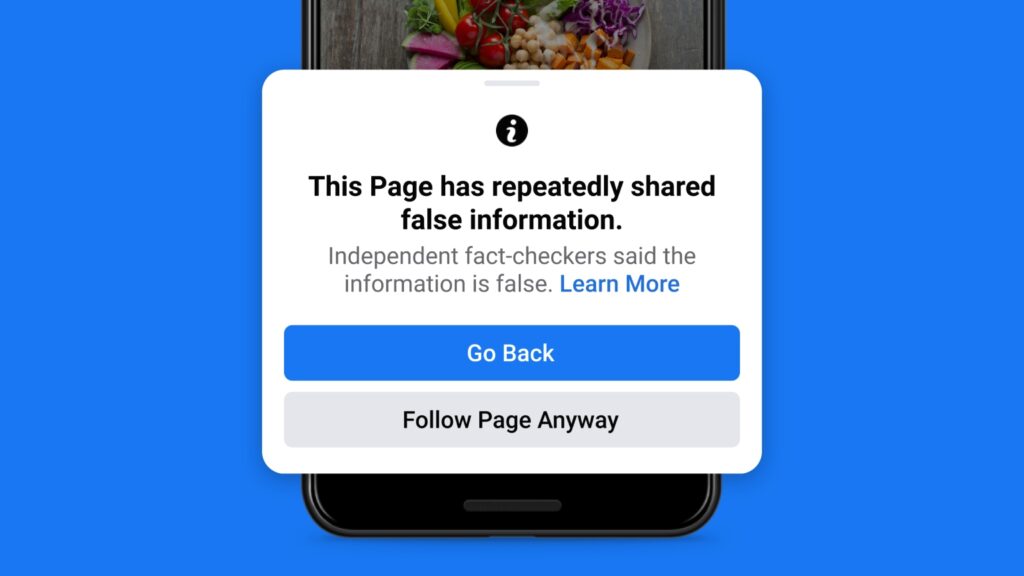
| Credibility label | Corrections and “false” labels, also known as “veracity label” (Morrow et al., 2021). | Instagram and Facebook apply labels to posts based on fact-checker ratings such as “false information” (Facebook Business Help Center, 2021). |
| Contextual label | Information that “serves to provide more information to the user that the exact content of a user-generated post does not provide” (Morrow et al., 2021). | TikTok “detect[s] and tag[s] all videos with words and hashtags related to the COVID-19 vaccine [attaching] a banner to these videos with the message ‘Learn more about COVID-19 vaccines’” and links to a COVID-19 “information hub” of “verifiable, authoritative sources of information” (TikTok, 2020). |
| Removal | The temporary or permanent removal of a post from a platform feed. | YouTube removed a COVID-19 conspiracy theory video (“plandemic”) in May 2020 (Newton, 2020). |
| Downranking | Reducing the number of times a post appears in other users’ social media feeds. | Facebook downranks “exaggerated or sensational health claims, as well as those trying to sell products or services based on health-related claims” (Perez, 2019). |
We find that the simplified partisan narrative about credibility labels masks a more nuanced story: while there are indeed divided attitudes toward interventions, partisanship does not explain all the variance. We find that trust in institutions (broadly, but not specifically), frequency of social media use, and self-reported exposure to “appropriate” interventions predict support for interventions (broadly, but not specifically). Further, though the public is strongly opinionated about interventions in general, they are also uncertain about specific interventions and who deploys them.
Crucially, we recognize that self-reported attitudes on such topics alone do not tell us about an intervention’s efficacy toward its stated goals, or its long-term impact on user beliefs (Parry et al., 2021). However, by better understanding these attitudes, we provide a roadmap for how one might test the efficacy of interventions by recruiting from populations that are likely least inclined to support them. We also discuss how platforms may work to address the root causes and valid criticisms of interventions, such as the prevalence of algorithmic false positives, lack of transparency around intervention evaluations, and institutional distrust. While we concentrate on implications for platforms as the primary actors deploying interventions, we connect these suggestions to their implications for policymakers, journalists, and academics working in and around the misinformation field.
Implications for intervention design
1. Explainability: Make intervention sources and processes more explainable to audiences (Finding 1). Our findings show broad uncertainty about the extent of interventions (Figure 2) and how interventions occur across platforms (Figure 5). Platforms should therefore clearly explain intervention classification and repeal processes to users. Platforms may also benefit from interventions based on simple, comprehensible processes. For example, it may be easier for users to comprehend simple rules like limits on WhatsApp message forwarding (WhatsApp, 2021) compared to the sometimes ambiguous and opaque criteria for interventions like downranking (Donovan, 2020)—though this requires further study. Policymakers should emphasize intervention explainability when crafting misinformation policies, and academics working in AI explainability should consider how to meaningfully explain the results of algorithmic content moderation to audiences (Bhatt, Andrus, Weller, & Xiang, 2020). Journalists also have a role in explaining the general practices and techniques behind misinformation interventions to the public.
2. Transparency: Motivate design changes with intended and actual intervention effects, since interventions may never be universally supported (Finding 2). We did not find dramatic differences in support and opposition for different interventions (Figure 4), suggesting that the exact form of the intervention may not affect public opinion. Rather, the public appears divided on the premise of social media platforms intervening on misinformation in the first place. Platforms, in conversation with policymakers, academics, and the public at large, should therefore better communicate their goals and measure intervention efficacy against those goals. While platforms and legislators regulating platforms should be accountable to public opinion, intervention design choices should not be made purely reactively. If interventions are accomplishing other goals, such as reducing exposure to and engagement with harmful public health misinformation, they should be deployed despite some negative public opinion.
3. Oversight: Consider large-scale transformations to how platforms operate and relate to the public, such as external oversight (Finding 3). Broad institutional distrust predicts disapproval of interventions, for Democrats and Republicans alike, (Figure 7) with only minor differences between approval of possible intervention sources (such as algorithms vs. platform users) (Figure 6). The ideal institution to classify content and apply interventions remains unclear based on public opinion. However, our prior qualitative research revealed that many were particularly concerned with social media platforms’ possible conflicts of interest, such as between engagement goals and the partisan biases of corporate leadership (Saltz et al., 2021). Journalists should be aware of how the same institutional distrust plagues their work (Zuckerman, 2017); however, they can also report on the platforms to empower people to better assess their social media platforms. It’s also possible that trust could be improved by incorporating more external oversight and regulation from policymakers; doing so could offer checks and balances against any given institution.
4. Trust: Platforms should strive to minimize errors of automated systems that reduce trust in interventions while amplifying positive encounters with misinformation interventions (Finding 4). While this is an intuitive suggestion, platforms should recognize how even slight errors degrade labeling systems as a whole and the importance of curating positive experiences with interventions. Our findings indicate that encounters with misinformation interventions are quite common (Figure 1), and users often find them inappropriate or inaccurate. We also find that negative experiences with misinformation labels predict less support for labels, across all groups (Figure 8). Hence, we recommend further research on reducing interventions that are perceived by users as false positives. However, such research must also recognize that the complete elimination of false positives might be unattainable; and that there are profound limits to automated systems’ ability to solve platforms’ misinformation challenges (Li & Williams, 2018). At a minimum, the extent of these false positives across platforms should be more deliberately defined, measured, and reported, rather than captured through ad hoc observations and publicity generated by affected users and journalists (Knight, 2021; Rumpf, 2020).
Findings
We depict our findings with a series of descriptive statistics, as well as specific predictors for support or opposition to types of misinformation interventions (details on how we identify predictors can be found in Methods). We use “predict” interchangeably with “correlate” or “associate with,” and stress that none of our claims are causal.
For visual clarity, we present most of our results using a 3-point classification of political party affiliation (Democrat/Republican/Neither), but distinguish between strong and weak partisans where relevant. Question wording is discussed in Methods and described in full in our pre-registration (Saltz et al., 2021). Additional or supporting analyses without accompanying visualizations are also presented in greater detail in the Appendix.
Finding 1: Exposure to online misinformation interventions is common, but comprehension is limited.
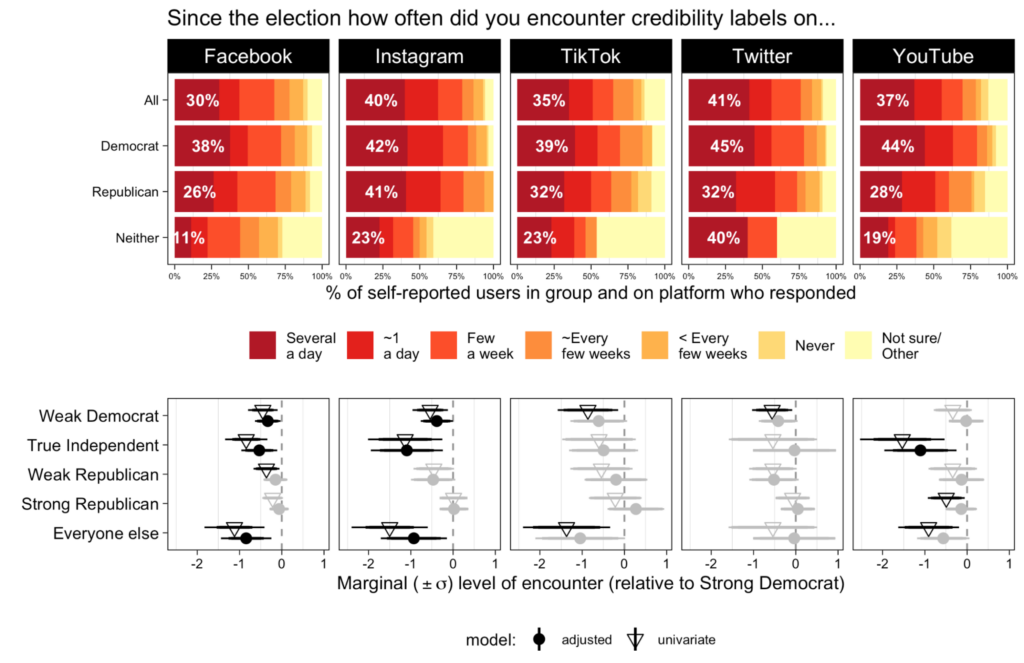
Since the 2020 U.S. election, a near-majority of our survey respondents (49%) have encountered platform credibility labels. Of these, some (44-72% depending on platform) report encountering them on a daily basis or more. The top half of Figure 1 shows that exposure is highly frequent across party lines, though typically more Democrats (52-68% depending on platform) report seeing credibility labels daily than Republicans (44-62%), with the exception of on Twitter. Notably, Democrats also reported following accounts they disagreed with at higher rates than Republicans (31% vs. 22%) as shown in Appendix Figure C4. Thus, it is difficult to conclude anything about the political leaning of the content respondents encountered.
However, the bottom half of Figure 1 reveals that stronger partisans—both Democrats and Republicans—report greater intervention exposure than weaker partisans. More precisely, we estimate that weak partisans, True Independents (those explicitly self-identifying as such or clearly expressing no preference between the two parties), and “everyone else” (who did not respond) report levels of exposure 1-2 standard deviations below that of Strong Democrats and Strong Republicans.
Despite high self-reported rates of exposure, respondents’ perceptions of how much social media content is actually audited are both mixed and uncertain. Figure 2 shows that more than 40% believe that content is mostly or all checked, and 17.5% are unsure about how much content is checked. Again, there are slight asymmetries by party: Democrats believe more content is fact-checked (49% believe all/most) than Republicans (34% believe all/most), but Republicans are more uncertain (20%) than Democrats (12%).
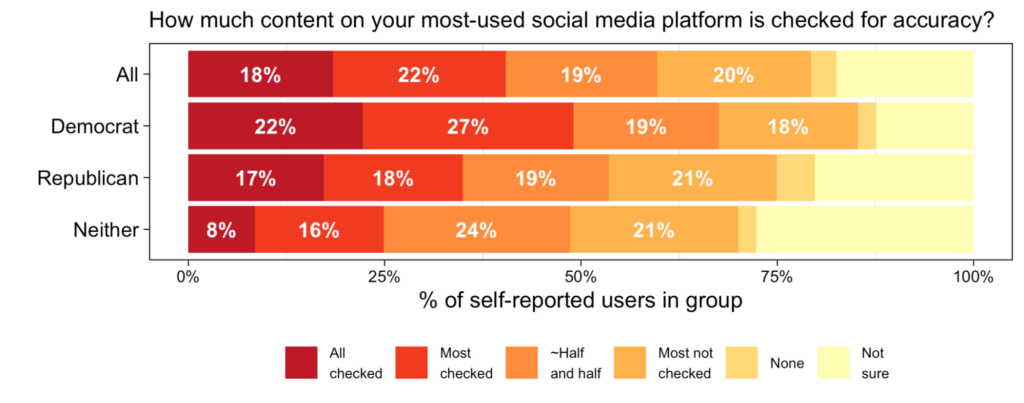
To be sure, even the authors are uncertain about the ground truth: it depends on which platform and what one means by “checked for accuracy.” For example, if all posts are automatically scanned with the potential to be flagged by detection systems, does this mean all posts are “checked” on these platforms? Nevertheless, this finding reveals that respondents largely perceive that at least some portion of content is checked.
Finding 2: Support for interventions is polarized by political party.
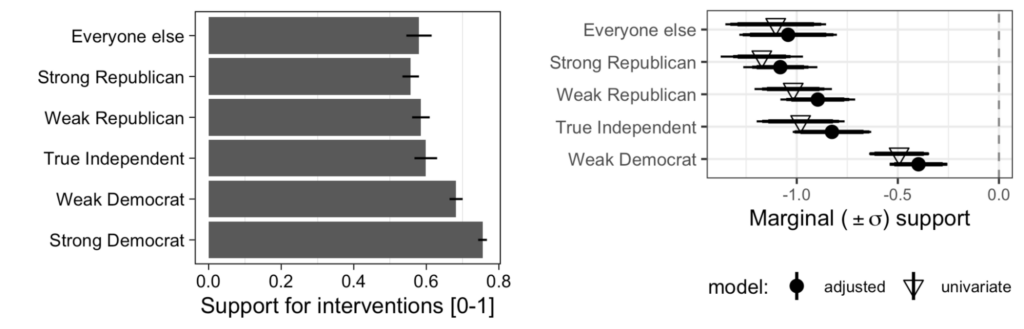
As we hypothesized, partisanship strongly predicts respondents’ broad support for or opposition to interventions, measured by aggregating a battery of questions (details in Methods). However, Figure 3 shows that Strong Democrats are in a league of their own, nearly at the ceiling of possible support for misinformation interventions while all other categories (including Weak Democrats) show detectably less enthusiasm for interventions. Put differently, the attitudes of True Independents and “everyone else” are closer to the attitudes of Republicans.
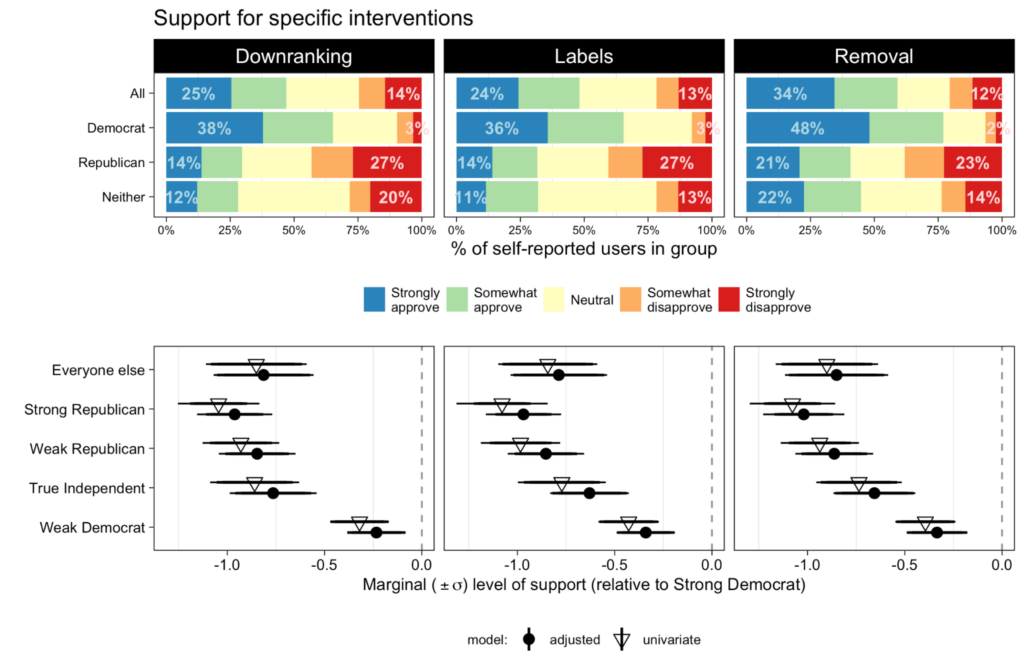
Disaggregating to specific intervention types (downranking, content labels, and removal), the top half of Figure 4 shows that support is asymmetric by party. Republicans evenly oppose all intervention types (labeling, downranking, removal), while Democrats especially strongly support removal (23% vs. 17-18% with other types). The bottom row of coefficients shows that Strong Democrats, in particular, express greater support for all intervention types than all other political groups (nearly a standard deviation more than Weak and Strong Republicans and nearly half a standard deviation more than Weak Democrats).
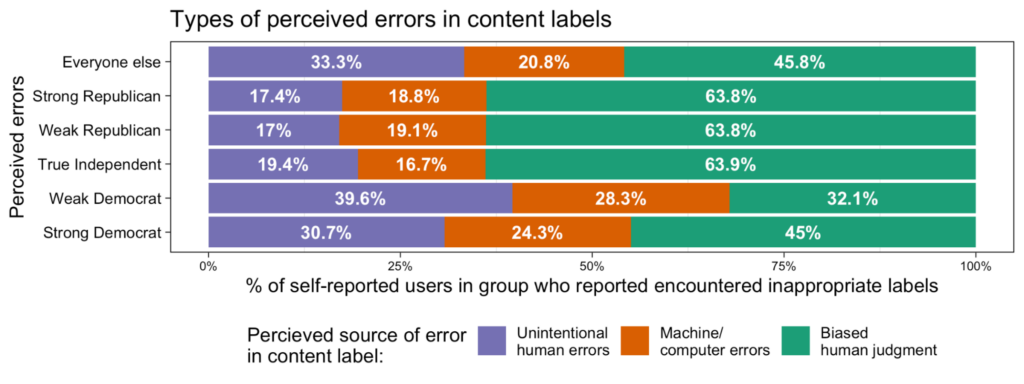
Next, Figures 5 and 6 confirm that Republicans are more likely to see interventions as biased than Democrats. 59% of Strong Republicans attribute errors in “inappropriate” labels they’ve encountered due to biased judgment, while only 43% of Strong Democrats report the same. However, it is worth pointing out that in nearly every group including Strong Democrats, more respondents perceive error due to biases in judgment rather than unintended mistakes by humans or algorithms.
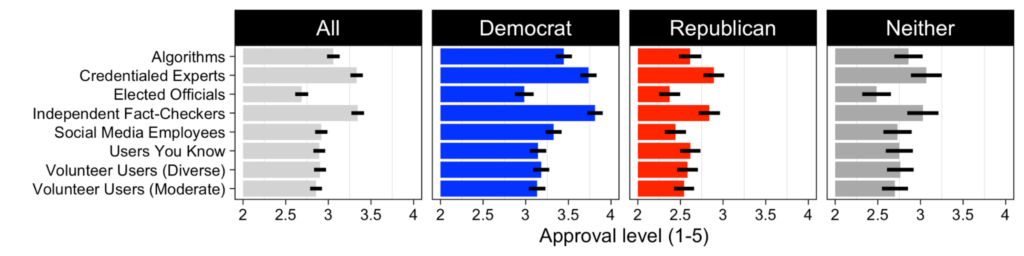
Finally, Figure 6 shows that when asked about particular sources of intervention, Republicans on average disapprove (give a mean rating of <3) of all options, while Democrats, in comparison, approve (>3) of nearly all options. Despite the aforementioned polarized support, both Democrats and Republicans most endorse independent fact-checkers and credential experts and least endorse Elected Officials to adjudicate or consult on intervention decisions. Republicans’ approval of credentialed experts is surprising given the prevalence of anti-expert attitudes on the right (Stecula et al., 2021; Motta, 2018), however, we note that (1) “credentialed expert” may take on differential meaning for Republicans and Democrats, and (2) this approval level is statistically or substantively indistinguishable from the others.
Taken together, this set of results corroborates partisan polarization in broad support for interventions. We note that partisan media diets may partially explain Republicans’ differential opposition to interventions. Appendix Figure B2 shows that even after adjusting for party affiliation, conservative slant of respondents’ self-reported news diets predicts decreased support for interventions across the board. Further, Appendix Figure B3 shows that people who don’t follow news closely feel less strongly about interventions (frequency of following news predicts 0.2–0.4 standard deviations of lower ambivalence about misinformation interventions).
Why might this be? Anti-platform policy cues from what political scientists term “elites” such as Fox’s Tucker Carlson (Carlson, 2020) may activate these attitudes, signaling that the party line on social media interventions for Republicans is to oppose them, and for Democrats is to support them. Alternatively, this may be due to lower political interest or knowledge of interventions rather than the absence of elite cues.
Finding 3: Broad trust in institutions predicts support for misinformation interventions.
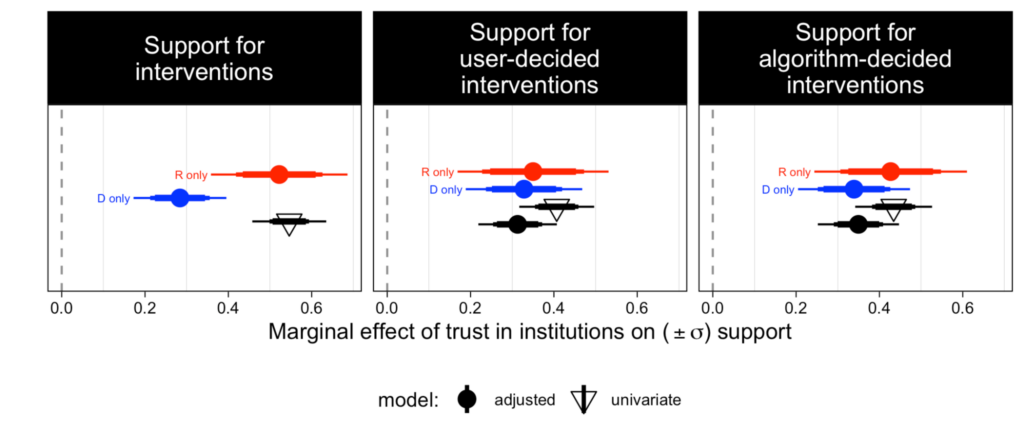
Confidence in American public institutions (e.g., elected officials, the Supreme Court, mainstream news media, universities) to act in the public good robustly predicts support for all categories of misinformation interventions amongst both Democrats and Republicans (Figure 7). In fact, institutional trust delivers the strongest effect for Republicans, both on the overall support index (left panel) and average support for user adjudicated and algorithmically adjudicated options respectively (right two panels). Importantly, institutional trust does not overlap entirely with partisanship: the correlation between Democrat partisan identification and institutional trust is only 0.14.
We examined whether trust in specific institutions drives support for some interventions over others and show (Appendix Figure C8) that this is largely not the case: most respondents’ confidence across all our presented institutions were highly correlated, and there was little discernible mapping between trust in a particular institution and deference to that same institution as an intervention decision-maker (e.g., confidence in social media companies and deference to social media employees). However, some institutions do appear to be more important: Appendix Figure C8 and a separate machine learning analysis of intervention type attitudes (Appendix Figures C10, C11) show that trust in mainstream media outlets, fact-checkers, and the companies themselves more strongly predict positive attitudes than trust in other institutions. Taken together, our correlations suggest that the perceived legitimacy of social media interventions may be linked to the perceived legitimacy of social institutions more broadly.
Finding 4: Positive experiences with misinformation interventions predicts increased support across groups.
As with institutional trust, positive experiences with misinformation interventions marginally predict higher support for interventions (Figure 8), even for Republicans who oppose them in general. Conversely, people across the political spectrum also reported encountering “inappropriate/inaccurate” interventions (Figure 5), and these experiences were associated with decreased support (most robustly for Republicans). Using a content intervention (e.g., blocking a friend, reporting a post) correlates with support, though being on the receiving end does not correlate with a backlash. Furthermore, we find that the more people use platforms (both in the number of platforms and time spent on each platform), the more likely they are to support interventions. We hesitate to say the experiences reported here are themselves responsible for changes in attitudes: it’s possible respondents perceived interventions as appropriate (or used them) because of their prior positive attitudes.
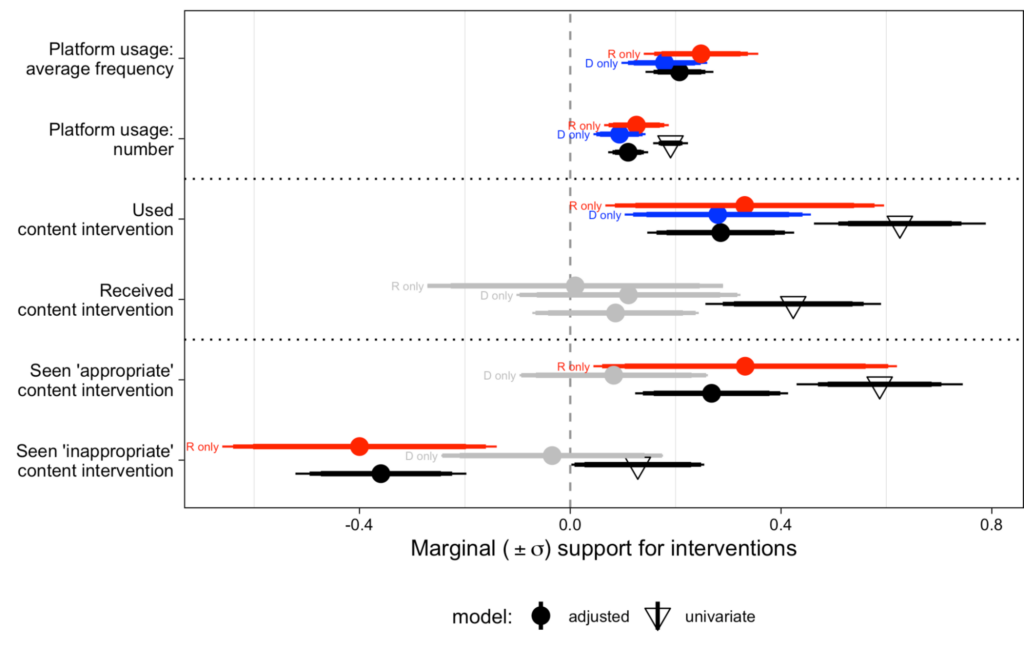
Overall, this suggests that, in some cases, familiarity through usage, greater perceived intervention efficacy, and reduction of perceived false positives could help to overcome disapproving attitudes—though as described in Implications, attitudes towards interventions should be distinguished from intervention efficacy (i.e., superficially improving attitudes toward interventions without addressing the underlying concerns should not be a goal in and of itself).
Methods
Prior to any data collection, we registered our pre-analysis plan which included our research questions, prior hypotheses, and our measurement and analysis strategies, and can be found at (Barari et al., 2021). We summarize relevant components below.
Research questions and hypotheses
We initially outlined a number of research questions and hypotheses related to interventions. These questions and hypotheses were based on qualitative findings in Saltz and colleagues (2021). We fielded an online survey in order to evaluate how these findings generalized to a broader, demographically representative population sample in the United States.
Our four research questions asked: (RQ1) how the strength of partisanship predicts overall support for online misinformation interventions, (RQ2) how trust in institutions predicts support for specific groups or resources as the sources of online misinformation, (RQ3) how preference for different types of media predicts general support for online misinformation interventions, and (RQ4) how specific platform experiences (e.g., exposure, usage) with interventions as well as the overall extensive and intensive margins of online platform usage predicts general support for online misinformation interventions.
In brief, we hypothesized that stronger Republicans would support interventions less than all other groups and perceive interventions as more biased (RQ1); that trust in institutions would predict increased support for interventions, in particular, user-adjudicated interventions but not algorithm-assisted interventions (RQ2); that conservative media preferences would decrease intervention support while overall news engagement would increase ambivalent responding (RQ3); and that a variety of positive exposures or use cases of interventions would also increase support (RQ4). As the Findings section details, all our hypotheses, except our distinction between algorithmic and human interventions sources in RQ2, were robustly corroborated.
For narrative clarity, we selected what we believed to be the most insightful findings in each category, rather than enumerating results for each hypothesis. The Appendix provides corresponding plots to all our pre-registered hypotheses as well as a number of exploratory analyses.
Data collection
Our survey responses were collected using Lucid, a commercial, online, opt-in survey panel with 1,207 respondents. The main survey ran on Qualtrics from March 19 to March 22, 2021. Our respondents were quota-matched on gender, age, and income according to the 2018 Current Population Survey. We included two attention checks within the survey: 79% of respondents passed the first, 52% passed the second, and 91% passed at least one. To ensure our results are representative of both attentive and inattentive Internet users, we included respondents who failed attention checks in our analysis; results do not change if they are excluded. The highest rate of missingness for any question was 12% (for age), with most questions only missing 2-3% of responses, in line with our expectations following our pilot study.
Measures
To prevent noisy inferences in survey research, particularly when it comes to nuanced or cognitively straining topics, it is crucial to measure opinions using multiple questions (Ansolabehere et al., 2008). We briefly discuss such measures used in the main text here.
To measure support for online interventions, we averaged responses to several questions (see pre-analysis plan) into a combined index that operationalizes support for interventions through a diversity of related measures, normalized to a continuous measure from 0 to 1. Our index has a Cronbach’s alpha of 0.88, suggesting a high level of internal validity.
Similarly, we measure institutional trust by average 5 point categorical responses to the question: “how much confidence, if any, do you have in each of the following to make decisions in the best interests of the public?” for various institutions: elected officials, professional fact-checkers, mainstream news media, your local news outlets, academic research institutions, social media companies. Cronbach’s alpha for this index was similarly high at 0.9. Responses across each institution were moderately correlated, between 0.52 and 0.67.
The extensive margin of social media usage is simply a count of the number of social media platforms each respondent uses (i.e., provides a response other than ‘Never’ to the closed items or enters additional platforms in the open text question). Similarly, intensive margin of social media usage measures the average frequency [6 point scale] of usage of platforms that each respondent reports using.
Analysis
We test each of our pre-registered hypotheses using a two-sided t-test on each coefficient of interest estimated via ordinary least squares.
For each confirmatory research question (those with strong prior hypotheses) and exploratory research question (those without prior hypotheses) that involved multiple hypothesis tests, we adjusted resulting p-values according to the Benjamini-Hochburg (1995) procedure for false discovery rate correction. The purpose of this is to set a more conservative significance threshold: without this, performing multiple tests might produce p-values that happen to fall below our significance threshold just by chance. We set the familywise threshold for confidently failing to reject each null hypothesis at ???? = 0.05.
Control variables in all of our adjusted models above include: partisan affiliation (when it is not the independent variable displayed), age group, gender, income category, digital literacy normalized to [0,1], and race/ethnicity (see pre-analysis plan for exact wording). All coefficients in this paper are displayed with overlapping 90% and 95% corrected intervals, both adjusted via Benjamini-Hochburg.
Limitations and future research
Our approach has limitations that raise questions for further investigation. First, we emphasize that attitudes should not be confused with efficacy: that is, just because a person does not support a particular intervention such as a credibility label does not mean it is necessarily ineffective for a stated goal, such as accurate comprehension and recall of a credible claim. However, understanding attitudes is a crucial starting point for research on the interaction between attitudes and intervention efficacy.
Second, we recognize that our survey reflects the political and social climate of a particular moment. Notably, we also conducted this work in the months following a highly polarized presidential election in the United States. We suggest conducting a longitudinal study to better understand how social and political dynamics implicate our findings and how particular events might affect attitudes towards misinformation interventions.
Next, given the scope of this survey, we were not able to exhaustively elicit preferences on more specific platform interventions. We recommend a follow-up experimental study, such as a conjoint task study, to isolate preferences for specific language and design elements for various groups.
Finally, all surveys are limited in their external validity. Survey responses are prone to social desirability bias (DeMaio, 1984) and media exposure is difficult to accurately self-report (Guess, 2015). In particular, the self-reported frequencies are likely to be biased upward, or reported as more frequent than in actuality (Parry, 2021). Additional research opportunities to bolster the external validity of our findings include: 1) adapting and expanding similar surveys to compare findings to regions outside the United States, 2) continuing qualitative user research similar to our prior research (Saltz et al., 2021) with intervention-skeptical groups, and 3) incorporating behavioral data using tools such as an opt-in data browser2For an example, see the Citizen Browser Project from The Markup (The Markup, 2021); also see Guess (2015, 2021). to better understand the distribution and types of interventions encountered by various users across platforms.
Topics
Bibliography
Ansolabehere, S., Rodden, J., & Snyder, J. M. (2008). The strength of issues: Using multiple measures to gauge preference stability, ideological constraint, and issue voting. American Political Science Review, 102(2), 215–232. https://doi.org/10.1017/S0003055408080210
Barari, S., Saltz, E., & Leibowicz, C. (2021, March 20). Who supports online misinformation interventions?. OSF. https://doi.org/10.17605/OSF.IO/M9T72
Benjamini, Y., & Hochberg, Y. (1995). Controlling the false discovery rate: A practical and powerful approach to multiple testing. Journal of the Royal Statistical Society: Series B (Methodological), 57(1), 289–300. https://doi.org/10.1111/j.2517-6161.1995.tb02031.x
Bhatt, U., Andrus, M., Weller, A., & Xiang, A. (2020). Machine learning explainability for external stakeholders. arXiv. https://arxiv.org/pdf/2007.05408.pdf
Blunt, D., Coombes, E., Mullin, S., & Wolf, A. (2020). Posting into the void: Studying the impact of shadowbanning on sex workers and activists. Hacking//Hustling. https://hackinghustling.org/posting-into-the-void-content-moderation
Bradshaw, S., Elswah, M., & Perini, A. (2021). Look who’s watching: Platform labels and user engagement on state-backed media outlets. arXiv. https://arxiv.org/abs/2107.06978
Carlson, T. (2020, May 28). Tucker Carlson: Big tech authoritarians are willing to censor Trump, think nothing of silencing you. Fox News. https://www.foxnews.com/opinion/tucker-carlson-big-tech-authoritarians-are-willing-to-censor-trump-think-nothing-of-silencing-you
DeMaio, T. J. (1984). Social desirability and survey measurement. In C. F. Turner, & E. Martin (Eds.), Surveying subjective phenomena: A review, pp. 257–281. Russel Sage.
Donovan, J. (2020, November 6). Why social media can’t keep moderating content in the shadows. MIT Technology Review. https://www.technologyreview.com/2020/11/06/1011769/social-media-moderation-transparency-censorship
Facebook Business Help Center. (2021). Rating options for fact-checkers. https://www.facebook.com/business/help/341102040382165?id=673052479947730
Guess, A. M. (2015). Measure for measure: An experimental test of online political media exposure. Political Analysis, 23(1), 59–75. https://doi.org/10.1093/pan/mpu010
Knight, W. (2021, March 1). Why a YouTube chat about chess got flagged for hate speech. Wired. https://www.wired.com/story/why-youtube-chat-chess-flagged-hate-speech
Li, S., & Williams, J. (2018). Despite what Zuckerberg’s testimony may imply, AI cannot save us. Electronic Frontier Foundation. https://www.eff.org/deeplinks/2018/04/despite-what-zuckerbergs-testimony-may-imply-ai-cannot-save-us
Mena, P. (2020). Cleaning up social media: The effect of warning labels on likelihood of sharing false news on Facebook. Policy & Internet, 12(2), 165–183. https://doi.org/10.1002/poi3.214
Motta, M. (2018). The dynamics and political implications of anti-intellectualism in the United States. American Politics Research, 46(3), 465–498. https://doi.org/10.1177/1532673X17719507
Morrow, G., Swire-Thompson, B., Polny, J., Kopec, M., & Wihbey, J. (2020). The emerging science of content labeling: Contextualizing social media content moderation. SSRN. http://dx.doi.org/10.2139/ssrn.3742120
Newton, C. (2020, May 12). How the ‘Plandemic’ video hoax went viral. The Verge. https://www.theverge.com/2020/5/12/21254184/how-plandemic-went-viral-facebook-youtube
Oeldorf-Hirsch, A., Schmierbach, M., Appelman, A., & Boyle, M. P. (2020). The ineffectiveness of fact-checking labels on news memes and articles. Mass Communication and Society, 23(5), 682–704. https://doi.org/10.1080/15205436.2020.1733613
Owen, L. H. (2020). Two new studies show, again, that Facebook doesn’t censor conservatives. Nieman Lab. https://www.niemanlab.org/2020/10/two-new-studies-show-again-that-facebook-doesnt-censor-conservatives/
Parry, D. A., Davidson, B. I., Sewall, C. J., Fisher, J. T., Mieczkowski, H., & Quintana, D. S. (2021). A systematic review and meta-analysis of discrepancies between logged and self-reported digital media use. Nature Human Behaviour. https://doi.org/10.1038/s41562-021-01117-5
Pennycook, G., Bear, A., Collins, E. T., & Rand, D. G. (2020). The implied truth effect: Attaching warnings to a subset of fake news headlines increases perceived accuracy of headlines without warnings. Management Science, 66(11), 4944–4957. https://doi.org/10.1287/mnsc.2019.3478
Pennycook, G., Epstein, Z., Mosleh, M., Arechar, A. A., Eckles, D., & Rand, D. G. (2021). Shifting attention to accuracy can reduce misinformation online. Nature, 592(7855), 590–595. https://doi.org/10.1038/s41586-021-03344-2
Perez, S. (2019, July 2). Facebook news feed changes downrank misleading health info and dangerous ‘cures’. TechCrunch. https://techcrunch.com/2019/07/02/facebook-news-feed-changes-downrank-misleading-health-info-and-dangerous-cures
Rogers, R. (2020). Research note: The scale of Facebook’s problem depends upon how ‘fake news’ is classified. Harvard Kennedy School (HKS) Misinformation Review, 1(6). https://doi.org/10.37016/mr-2020-43
Rumpf, S. (2020, June 10). Facebook removed my silly Coronavirus meme of the cure. Mediaite. https://www.mediaite.com/online/facebook-took-down-a-ridiculous-coronavirus-meme-i-posted-two-months-ago-for-causing-physical-harm
Saltz, E., Barari, S., Leibowicz, C., & Wardle, C. (2021). Replication data for “Misinformation interventions are common, divisive, and poorly understood” [Data set]. Harvard Dataverse. https://doi.org/10.7910/DVN/HNFQVR
Saltz, E., Leibowicz, C. R., & Wardle, C. (2021). Encounters with visual misinformation and labels across platforms: An interview and diary study to inform ecosystem approaches to misinformation interventions. Extended Abstracts of the 2021 CHI Conference on Human Factors in Computing Systems. Association for Computing Machinery, 1–6. https://doi.org/10.1145/3411763.3451807
Stecula, D. A., & Pickup, M. (2021). How populism and conservative media fuel conspiracy beliefs about COVID-19 and what it means for COVID-19 behaviors. Research & Politics, 8(1). https://doi.org/10.1177/2053168021993979
TikTok. (2020, December 15). Taking action against COVID-19 vaccine misinformation. https://newsroom.tiktok.com/en-gb/taking-action-against-covid-19-vaccine-misinformation
The Markup. (2021). The citizen browser project-auditing the algorithms of disinformation. https://themarkup.org/citizen-browser
Wardle, C., & Derakhshan, H. (2018). Thinking about ‘information disorder’: Formats of misinformation, disinformation, and mal-information. In C. Ireton, & J. Posetti (Eds.), Journalism, ‘fake news’ & disinformation: Handbook for journalism education and training, (pp. 43–54). Unesco. https://en.unesco.org/sites/default/files/f._jfnd_handbook_module_2.pdf
WhatsApp. (2021). WhatsApp Help Center – About forwarding limits. WhatsApp FAQ. https://faq.whatsapp.com/general/chats/about-forwarding-limits
Yaqub, W., Kakhidze, O., Brockman, M. L., Memon, N., & Patil, S. (2020, April). Effects of credibility indicators on social media news sharing intent. Proceedings of the 2020 CHI Conference on Human Factors in Computing Systems, 1–14. https://doi.org/10.1145/3313831.3376213
Zuckerman, E. (2017). Stop saying fake news. It’s not helping. Ethan Zuckerman Blog. https://ethanzuckerman.com/2017/01/30/stop-saying-fake-news-its-not-helping
Funding
Funding for this study was provided by Partnership on AI. Partnership on AI is funded by a combination of philanthropic institutions and corporate charitable contributions.
Primary corporate funding is always considered general operating support and legally classified as non-earmarked charitable contributions (not donations in exchange for goods or services, or quid pro quo contributions) to avoid the possibility of conflict in corporate funders having undue influence on Partnership on AI’s agenda or on particular programs.
More detail on Partnership on AI’s funding and governance is available online.
Competing Interests
There are no competing or conflicts of interests among any of the authors.
Ethics
The survey and this article were reviewed by the General Counsel at Partnership on AI. The survey was not presented to an institutional review board prior to the study.
Human subjects provided opt-in consent per Lucid’s privacy policy. Participants were provided an overview of the survey’s contents before choosing to begin the survey, as shown in the pre-registration. They were also able to leave the survey at any time.
Ethnicity and gender categories were provided by the respondents, with the option for open responses if none of the listed categories were satisfactory. These data were collected to ensure a demographically representative sample, as well as to enable exploratory analysis of intervention attitudes by these categories.
Copyright
This is an open access article distributed under the terms of the Creative Commons Attribution License, which permits unrestricted use, distribution, and reproduction in any medium, provided that the original author and source are properly credited.
Data Availability
All materials needed to replicate this study are available via the Harvard Dataverse: https://doi.org/10.7910/DVN/HNFQVR
Acknowledgements
We wish to thank members of the Partnership on AI’s AI and Media Integrity Steering committee, Jonathan Stray, Tommy Shane, and Nicholas Dias for feedback on our approach and early drafts.
Authorship
Emily Saltz and Soubhik Barari contributed equally to this work.