Peer Reviewed
Research note: Lies and presidential debates: How political misinformation spread across media streams during the 2020 election
Article Metrics
8
CrossRef Citations
PDF Downloads
Page Views
When U.S. presidential candidates misrepresent the facts, their claims get discussed across media streams, creating a lasting public impression. We show this through a public performance: the 2020 presidential debates. For every five newspaper articles related to the presidential candidates, President Donald J. Trump and Joseph R. Biden Jr., there was one mention of a misinformation-related topic advanced during the debates. Personal attacks on Biden and election integrity were the most prevalent topics across social media, newspapers, and TV. These two topics also surfaced regularly in voters’ recollections of the candidates, suggesting their impression lasted through the presidential election.
Research Questions
- What false and misleading statements mentioned during either debate gained traction during the campaign season?
- How was misinformation from the debates reflected across modes of communication? On what media streams did discussion of these claims grow?
- What topics from the debates made an impression on the public? What key features distinguished these from topics that did not become salient?
Essay Summary
- We studied how the 2020 U.S. presidential debates reinforced misinformation themes, which spread through multiple media streams: social media, newspapers, and cable TV.
- We analyzed 14 misinformation-related topics advanced by the presidential nominees during the September 29 and October 22 debates, comparing how these topics were discussed across media and were recalled by the general public in open-ended surveys.
- The misinformation-related topics that garnered the most media attention and had highest levels of recall by ordinary Americans were personal attacks on Joe Biden and election integrity. Newspapers and TV were the most highly correlated sources in terms of misinformation-related coverage.
- Following the first debate, Twitter conversations about the candidates focused on personal attacks on the Biden family. Election integrity was discussed more consistently but also grew across media around the debates.
- Misinformation-related topics mentioned in the debates that received moderate media attention, such as taxes, climate, and racism, were recalled far less often by ordinary Americans. This suggests that both political mentions and media attention are necessary but insufficient conditions for misinformation-related topics to “stick” in public memory.
- We suggest that discussion of false claims in the media—whether supporting or refuting them—facilitates the diffusion and acceptance of misinformation, enabling political elites to distort the truth for partisan gain.
Implications
While political figures misrepresenting facts is hardly novel, the role of media coverage in repeating candidates’ claims has become hotly contested in a time of political polarization and media fractionation some have called the “post-truth era” (Lewandowsky et al., 2017). Indeed, evidence that moderate numbers of Americans share misperceptions about political issues (Pasek et al., 2015) and candidates (Budak, 2019) raises important questions about how misinformation propagates through society and what role various media play in that process. We contribute to this line of inquiry by studying how misinformation pushed by presidential candidates reverberates through the media and is later recalled by the public. We use the term “misinformation” broadly to refer to factually inaccurate but genuine understandings (Kuklinski et al., 2000, p. 792; Maurer & Reinemann, 2006, pp. 492–493), regardless of their origins or pathways through the complex information ecosystem (Scheufele & Krause, 2019).
To date, researchers have shown the power of media to echo partisan attacks and leaders’ misleading claims (Jerit & Barabas, 2006; Shapiro & Bloch-Elkon, 2008), the virality of myths in online communities (Barthel et al., 2016; Vosoughi et al., 2018), and the importance of social media platform policies for mitigating the reach of misinformation (e.g., Allcott et al., 2019; Bode & Vraga, 2015).1The role of media in spreading misinformation is all the more important given a number of indicators of public susceptibility to these claims, such as generally low levels of accurate political knowledge (Graham, 2020; Neuman, 1986), an inability to recognize misinformation (McGrew et al., 2018), and evidence that misinformation can distort political behavior among the “active misinformed” (Hochschild & Einstein, 2015). Despite such advances, little is known about the role political and communicative contexts play in shaping the misinformation ecosystem (Jerit & Zhao, 2020; Lazer et al., 2018). Our study responds to this need for research by tracing false claims from presidential candidates across communication domains to the recollections of individual citizens. By tracking a broad range of misinformation-related topics over time and media and determining which ones “go viral” and then “stick” in working memory, we provide a blueprint for comparing claims that are more versus less successful in penetrating public discourse.
To study how elite rhetoric2The terms “elite” and “elites” in this paper refer to those with significant direct influence over the messaging of a dominant political party. spreads through the media and draws the attention of ordinary citizens, our study leverages the public performance of televised presidential debates. Debates offer an exceptional opportunity for identifying false claims likely to attract partisan attention and spread through popular discourse. The learning effects of televised debates are well-known (Benoit & Hansen, 2004; Lemert, 1993), and viewers tend to actively process debate content to help inform their voting decisions (Ampofo et al., 2011; Chaffee, 1978; Eveland, 2001). For these reasons, false claims by presidential candidates during debates—especially by a sitting president—are likely to be recalled by the general public, even when more accurate information is available. As such, we expect that misinformation mentioned by political leaders during debates that evokes more discussion in the media will be more salient to the public.3However, despite the repetition of debate sound bites across time and media, the influence of televised debate content on public memory likely declines over time, replaced by more enduring forms of campaign messaging such as advertisements.
In our increasingly polarized political era, debates between party leaders are likely to trigger motivated reasoning (Festinger, 1957; Kunda, 1990; Lodge & Taber, 2013) and biased assessments of source credibility (Guillory & Geraci, 2013; Stecula & Pickup, 2021), leading individuals to accept and hold onto (Johnson & Seifert, 1994; Nyhan & Reifler, 2010) inaccurate claims that reflect preexisting biases.4Research has generally found corrections of misperceptions to be effective (Chan et al., 2017; Walter & Murphy, 2018) and backfire effects to be rare—that is, false beliefs usually don’t further entrench after correction attempts (Swire-Thompson et al., 2020; Wood & Porter, 2019). However, exposure to factual corrections affects political attitudes much less than it does specific factual beliefs (Nyhan et al., 2020), and in some cases, corrections can push those who share misinformation to do so more in the future (Mosleh et al., 2021). By connecting debate lies with media discourses and what people recall about the candidates, we show which false claims set the media agenda (e.g., Vargo & Guo, 2017; Vargo et al., 2018)—and, among these, which kinds get filtered out and which leave a lasting impression on ordinary Americans. We specifically contribute fine-grained comparisons of how misinformation is advanced by political candidates (Biden vs. Trump), is reproduced across media formats (TV vs. newspapers vs. social media),5In supplemental analyses (see Appendix D), we also compare the spread of misinformation discussion across conventional media organizations: left-leaning vs. right-leaning TV channels and newspapers, and those in purple states vs. others. and becomes consequential for public awareness. By positioning political leaders as key drivers and various media sources as carriers of misinformation, we bridge studies of elite influence and misinformation (which typically do not use real-time media data; e.g., Maurer & Reinemann, 2006; van Duyn & Collier, 2019) and analyses of media factionalization (which typically do not capture power dynamics; e.g., Iyengar & Hahn, 2009; Stroud, 2010). We echo calls for accountability across domains: for elites who push false narratives, for media that normalize politicians’ lies and distort scientific facts (e.g., Boykoff & Boykoff, 2004; Clarke, 2008), and for social media that play a role in facilitating partisan attacks and broadening the reach of misinformation (e.g., Chen et al., 2021; Stecula et al., 2020).
We argue that by providing the public with an information environment saturated with misinformation propagated by political elites, both traditional media and social media contribute to the diffusion and widespread acceptance of these false narratives. In other words, media attention has lasting consequences not only for what people encounter, but also for what they remember. A considerable body of research shows that repeatedly hearing a statement—such as a partisan-affiliated sound bite (Hallin, 1992)—makes it appear believable and trustworthy, increasing the chance that one will recall and use that information in future decision-making (Allport & Lepkin, 1945; Hasher et al., 1977; Schwarz et al., 2007). The media’s uncritical repetition of how elites frame the issues may settle into false perceptions of social consensus (e.g., Gershkoff & Kushner, 2005; Weaver et al., 2007) or heightened partisanship (e.g., Page & Shapiro, 1992; Zaller, 1992), but either way, a likely outcome is a misinformed public.
Even when media sources explicitly challenge false or misleading claims—as in the fact-check columns run by reputable news outlets—such correction attempts can reinforce the familiarity and normalcy of the myths they seek to debunk (Ecker et al., 2011; Lewandowsky et al., 2012). We use phrase matching to capture the normalizing influence of media coverage of misinformation, whether it promotes the lies or attempts to counter them. In other words, we study media contestation over false claims, capturing both the factual and false aspects of misinformation discussion.6We generally used phrases reflecting explicit false claims, but in cases where these were entangled with factual ones, we instead sought to capture the full, contested discussion. More precisely identifying media content making false claims would require custom machine learning classifiers for each myth for each stream; creating such models is beyond the scope of this paper. Our goal is not to disentangle the conversation, but rather to track how its full volume (attention given to each misinformation-related topic) changes through time on different information streams. Indeed, media engagement—regardless of stance toward candidates or issues—compounds the influence of political elites and allows them to set the terms of the debate, enhancing the power of presidential candidates (for instance) to distort the truth, undermine alternative views (Maurer and Reinemann 2006), and dispense narratives made memorable merely by their shock value, given that new information “sticks” (Morley & Walker, 1987). Although best practices for combating misinformation in the media remain poorly understood (Vosoughi et al., 2018; Yang et al., 2021), we show that discussion of misinformation clearly ebbs and flows in response to elites’ false claims. By connecting misleading political frames to both media coverage and public cognitions, our study shows how the ability of political elites to shape media narratives threatens both the media’s function as “gatekeepers” of verifiable information (Shoemaker & Vos, 2009; Soroka, 2012) and the core democratic value of a rational and informed citizenry (Bartels, 1996; Lipset, 1960). This study thus provides some of the clearest evidence to date that shifts in attention to misinformation-related topics across media streams encourage public awareness of those false claims.
Findings
Finding 1: Personal attacks on Biden and election integrity were the predominant misinformation-related topics across media streams after the 2020 U.S. presidential debates.
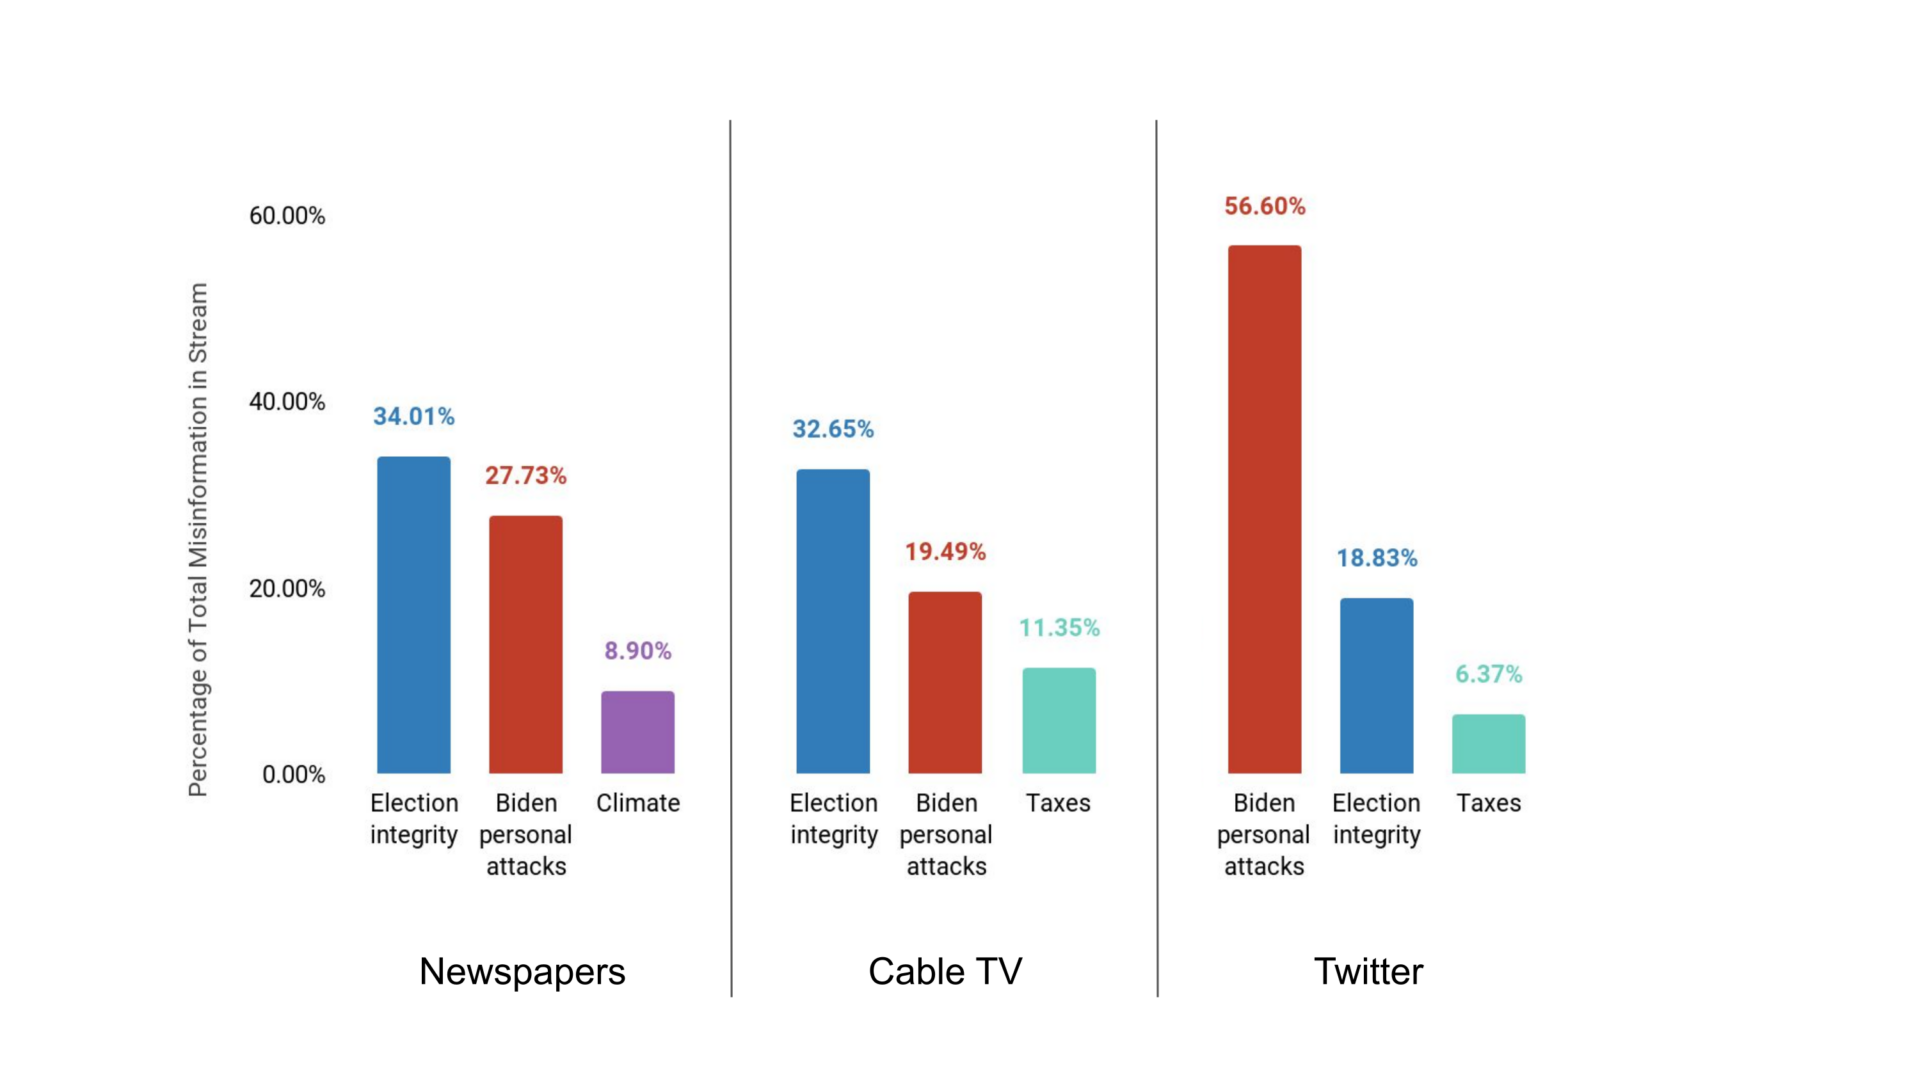
Based on fact-checking sites that tracked the presidential debates, we identified terms related to statements containing misinformation mentioned by the candidates and grouped them into 14 misinformation-related topics. Across media sources, the most common of these concerned Biden personal attacks and election integrity, as Figure 1 summarizes. The Biden personal attacks topic focused on Joe Biden and his family and was dominated by myths about his son Hunter Biden, partly driven by increased news coverage in September and October of Hunter Biden and the Republican inquiry into his behavior (e.g., his job at a Ukrainian energy company; Fandos, 2020). This topic was especially prevalent on Twitter, capturing over 56% of the misinformation-related mentions identified; in fact, “Hunter Biden” was the number one misinformation-related term on Twitter for four of the six weeks between the first debate and election day. Election integrity was related to false claims that the election was “rigged,” and many mail-in ballots were “fake.” These top two myth categories were followed at some distance by taxes and climate.
Finding 2: Discussion of myths mentioned during the debate increased from pre-debate levels.
Table 1 shows how misinformation mentions and proportions changed across streams over time. This growth was especially marked for tweets mentioning Biden, in which the misinformation proportion nearly quadrupled between the pre-debate and post-debate periods (from 2.61% to 10.1%). While the salience of misinformation-related topics increased more than sixfold in surveys about Biden (from 1.22% to 7.48%), the prevalence of these topics in surveys about Trump actually decreased from a pre-debate peak of 4.42% to 3.38%. The growth in misinformation associated with Biden but not Trump reflects an asymmetry in the candidates’ debate performances: While fact checkers identified 50 false assertions by Trump during the debates, Biden was flagged for only two (see Appendix A for counts and specific claims). In other words, while Trump succeeded (in terms of what people recalled) in redirecting attention during the debates to misinformation-related topics—many of which targeted Biden—his rival made little effort to do so.
| Time period | Newspapers | Television | Trump Twitter | Biden Twitter | Trump surveys | Biden surveys |
| Pre-debate (August 1–September 28)7Note that the pre-debate period is longer than either post-debate period and thus has greater totals. All dates refer to 2020. | 18,070 (17.4%) | 48,524 (1.85%) | 951,181 (1.36%) | 916,114 (2.61%) | 289 (4.42%) | 75 (1.22%) |
| Post-debate 1 (September 29–October 21) | 15,373 (28.7%) | 32,861 (3.44%) | 157,190 (1.88%) | 739,968 (9.24%) | 37 (1.41%) | 133 (5.47%) |
| Post-debate 2 (October 22–November 3) | 8,399 (28.9%) | 21,211 (3.84%) | 264,755 (1.85%) | 973,464 (10.1%) | 84 (3.38%) | 185 (7.48%) |
| Overall | 41,842 (22.4%) | 102,596 (2.49%) | 1,373,126 (1.48%) | 2,629,546 (4.99%) | 410 (3.52%) | 393 (3.55%) |
Finding 3: Misinformation-related topics that received debate and/or media attention were recalled more by the public.
Figure 2 shows a heatmap aggregating mentions into the pre-debate, post-debate 1, and post-debate 2-time frames during 2020. There is a clear connection between debate attention (vertical order), media attention (square color), and survey prominence (square size): Greater debate attention tends to pair with more media attention and stronger recollections. However, this is a loose correlation, as more debate attention does not guarantee more media attention or public recollection. For instance, misinformation about COVID-19 and climate are not discussed as much with respect to Trump and Biden as are Biden personal attacks or election integrity.9Indeed, even misinformation-related topics with low debate attention can get media attention (as taxes does), and misinformation-related topics with low to moderate debate and media attention can receive some public awareness (e.g., law enforcement). Nonetheless, misinformation-related topics that receive little debate and media attention (those at the bottom of the figure in lighter colors) have little chance of being remembered, suggesting that debate and media attention may be necessary but not sufficient conditions for public awareness.10While we study debates as a visible platform for political expression, elites may also draw attention to misinformation-related topics through campaign advertisements, speeches, and the like. We postulate that political attention is necessary for false claims to “go viral,” but debate attention may be replaced or supplemented by other forms of political expression.
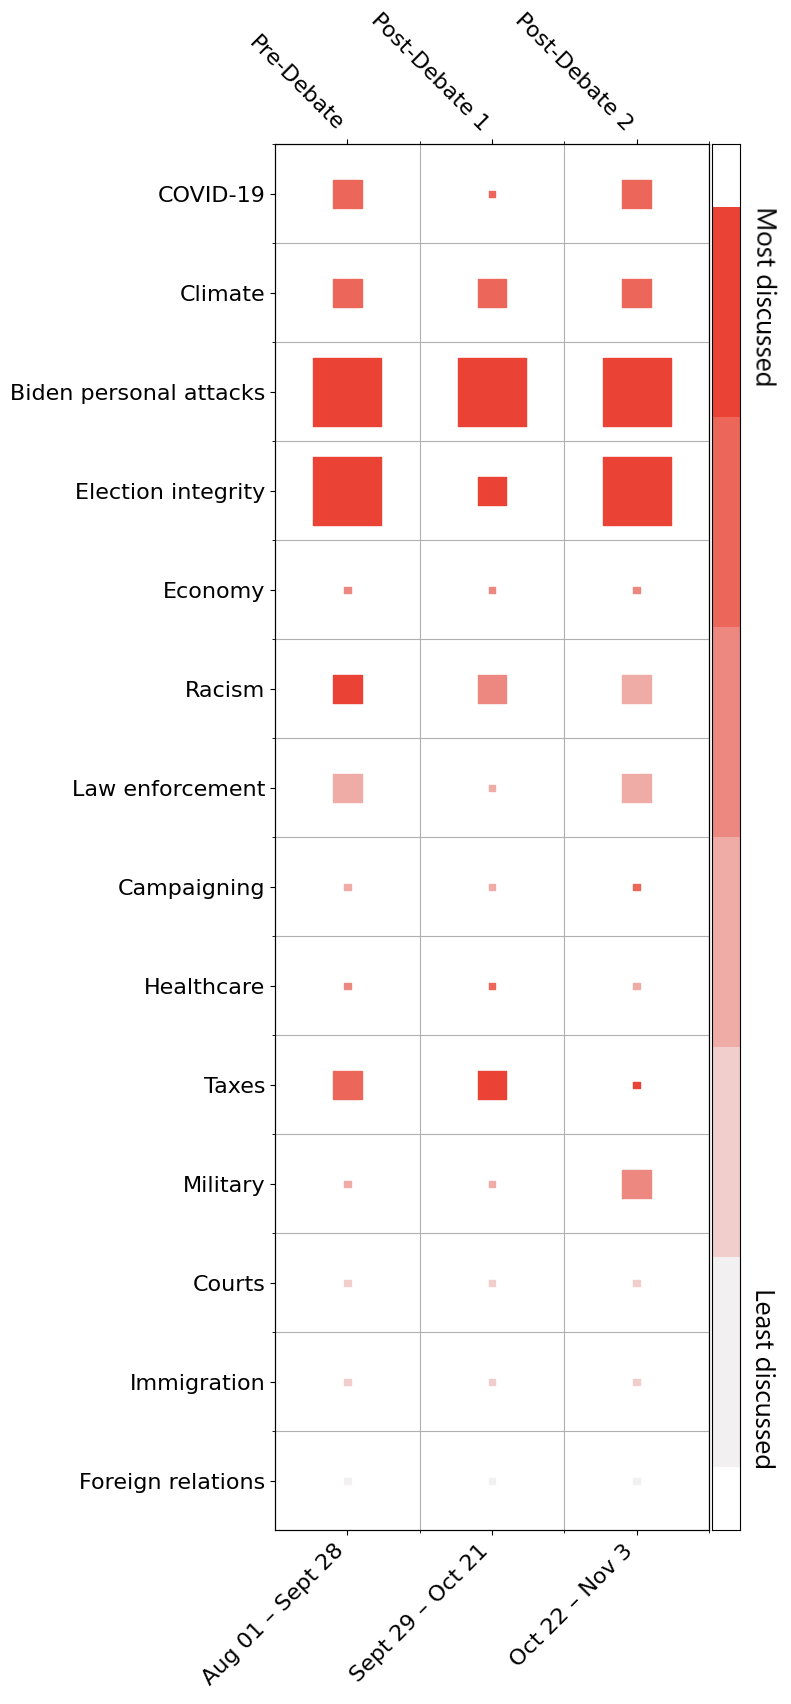
The imperfect correlation of public awareness with debate and media attention suggests that debates may be less significant platforms for spreading discussion of misinformation that has already been highlighted in the media. For instance, the prominence of discussions concerning taxes prior to and around the first debate is associated with the appearance of a New York Times report on September 27, 2020, stating that Trump paid only $750 in taxes in 2016 and 2017 (Buettner et al., 2020); one day after the release of this report, discussions related to the myth that Trump paid millions in taxes in these same years surged on Trump Twitter (see Figure 5). Indeed, political leaders may use a debate platform both to push their own agenda or narrative (such as asserting nepotistic business relations within the Biden family) and to intervene in existing public dialogue or controversies (for instance, by making false claims about Trump’s tax payments in response to the highly visible New York Times report).
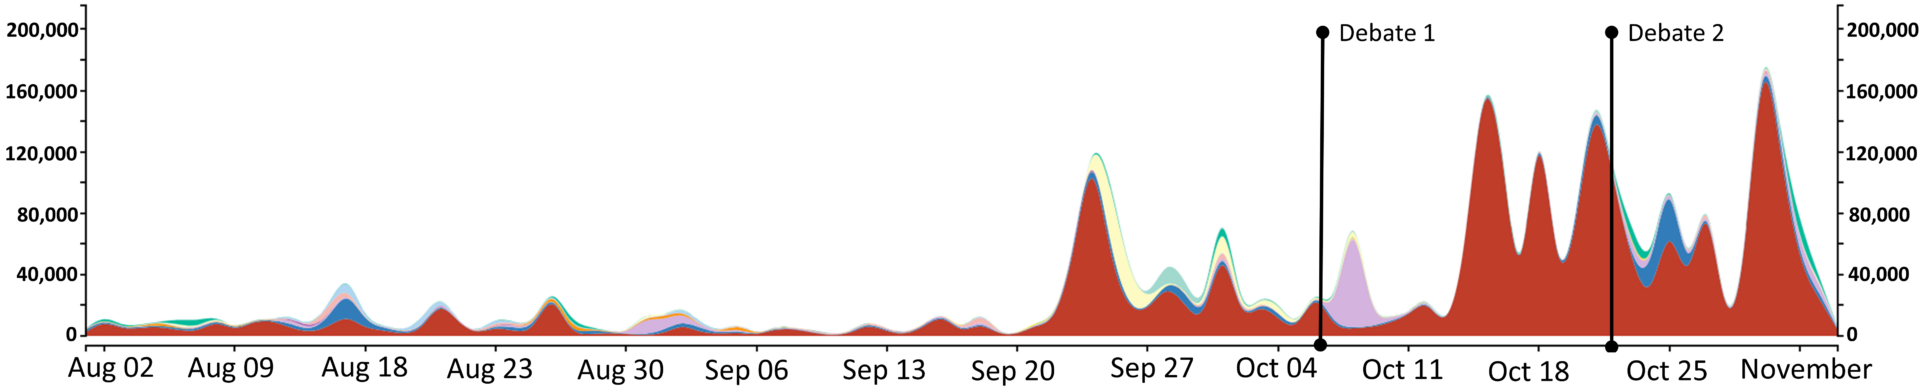
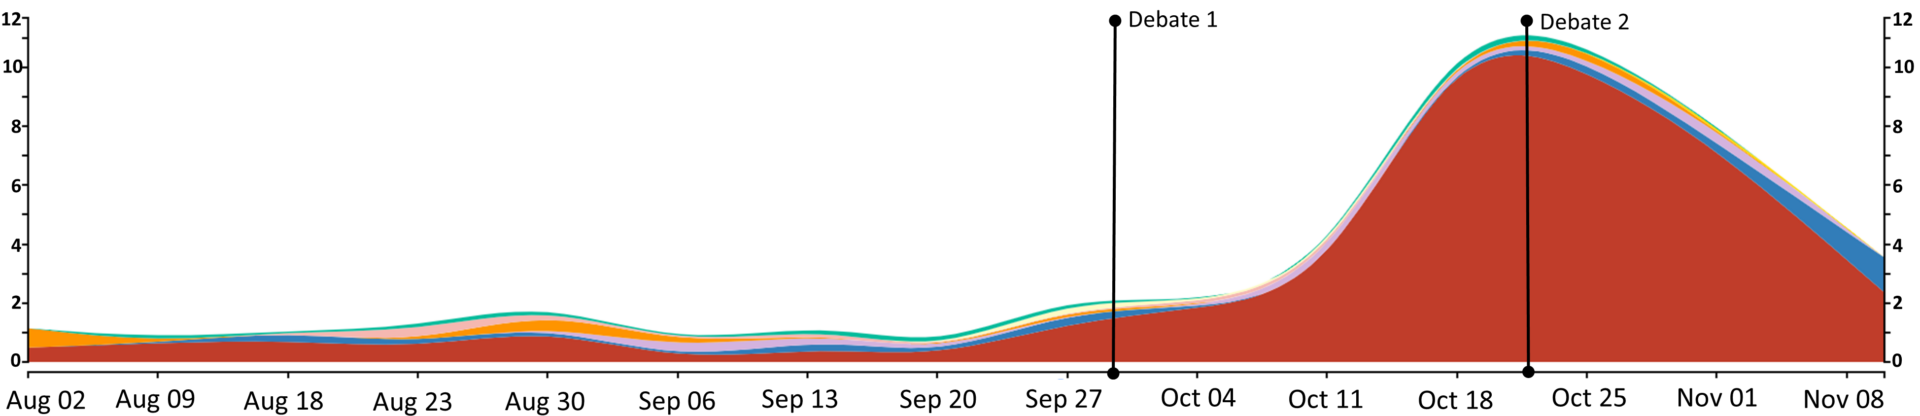
Finding 4: Most misinformation-related topics in newspapers were short-lived following each debate.
The time-series plot in Figure 3 shows three prominent spikes in misinformation-related coverage in newspapers. The largest peaks are for the two debates on September 29, 2020, and October 22, 2020, and the third-largest, around October 14, 2020, follows an unsubstantiated New York Post report claiming that Hunter Biden introduced his father to a Ukrainian energy executive (there is no evidence of this; Morris & Fonrouge, 2020). The New York Post report is linked to an increase in Biden personal attacks, while the debates are associated with a broader range of misinformation-related topics.
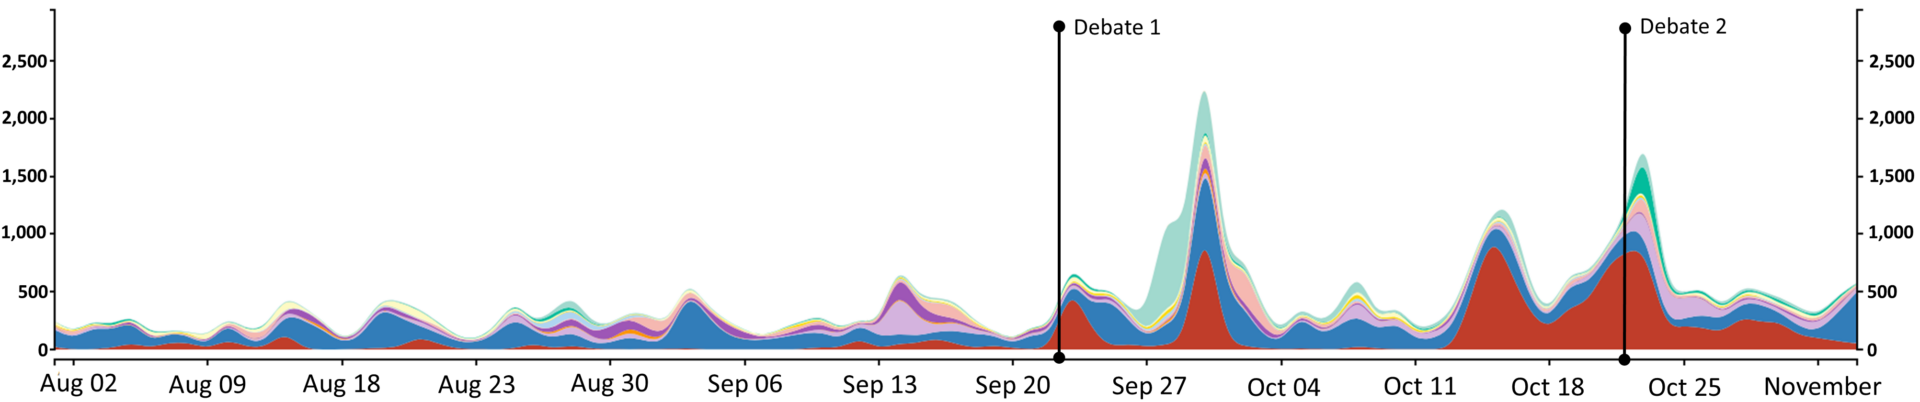
Most topics received the greatest newspaper attention on the day or two following each debate—except for Biden personal attacks and election integrity, which saw consistently high levels over time. Illustrating the typical pattern, discussions of COVID-19 misinformation surged around the first debate, while climate and racism ascended briefly following the second debate. In contrast, Biden personal attacks grew most from before to after the first debate (see Table 2). In newspapers, this topic hit a high of 42.5% of all misinformation11These percentages indicate the proportion of all misinformation in a given time period contributed by a given misinformation-related topic. This contrasts both with the percentages in Table 1—which show the proportion of misinformation mentions across topics to the number of units of information—and with the raw topic mentions visualized in the time-series plots. mentioned after the second debate, compared to 12.7% before the debates; election integrity dropped over that period from 42.2% before the debates to 22.3% thereafter.
| Misinformation-related topic and date range | Newspapers | Television | Trump Twitter | Biden Twitter | Trump surveys | Biden surveys |
| Biden personal attacks | ||||||
| Pre-debate12As in Figure 2, “pre-debate” here captures conversation before either debate took place (August 1, 2020–September 28, 2020), “post-debate 1” focuses on media content during and after debate 1 (September 29, 2020–October 21, 2020), and “post-debate 2” is limited to debate 2 and its aftermath (October 22, 2020–November 3, 2020; all these dates inclusive). Note that the pre-debate period is longer and thus has greater totals than either post-debate period. | 2,288 (12.7%) | 4,196 (8.6%) | 88,863 (9.3%) | 569,084 (62.1%) | 19 (6.6%) | 38 (50.7%) |
| Post-debate 1 | 5,743 (37.4%) | 9,736 (29.6%) | 57,929 (36.9%) | 639,625 (86.4%) | 11 (29.7%) | 124 (93.2%) |
| Post-debate 2 | 3,570 (42.5%) | 6,064 (28.6%) | 107,595 (40.6%) | 802,328 (82.4%) | 24 (28.6%) | 161 (87.0%) |
| Election integrity | ||||||
| Pre-debate | 7,619 (42.2%) | 21,499 (44.3%) | 463,058 (48.7%) | 91,031 (9.9%) | 250 (86.5%) | 9 (12.0%) |
| Post-debate 1 | 4,741 (30.8%) | 8,232 (25.1%) | 33,204 (21.1%) | 34,894 (4.7%) | 13 (35.1%) | 0 (0%) |
| Post-debate 2 | 1,869 (22.3%) | 3,769 (17.8%) | 52,679 (19.9%) | 79,012 (8.1%) | 51 (60.7%) | 14 (7.6%) |
Finding 5: Misinformation trends in newspapers and on cable TV were highly correlated.
The same trends applied to newspaper and television media streams, as Figure 4 shows (for proportions, see Table 2). As for newspapers, the COVID-19 and taxes topics surged on television around the first debate: the latter peaked at 14.5% after debate 1, while coverage of climate and racism misinformation-related topics increased after the second debate (see Appendix B, Table 2). In fact, newspapers and TV were the most highly correlated pair of sources we studied, ranging from 0.17 for the healthcare topic to 0.98 for racism.14The correlations between newspaper and TV coverage were 0.54 for COVID-19, 0.60 for election integrity, and 0.88 for Biden personal attacks; all Pearson correlation coefficients significant at p < 0.001. As the time-series plots hint, trends in the racism topic were highly correlated across streams—the highest of all topics we tracked—ranging from 0.46 between Trump- and Biden-related Twitter to 0.98 between newspapers and TV (both Pearson correlation coefficients significant at p < 0.001). See Appendix E for the complete correlation analysis between sources across topics. This suggests that these two more traditional (i.e., non-social media) streams may track the same stories, share sources and reporters, and/or seek to appeal to similar slices of the news-consuming U.S. public.
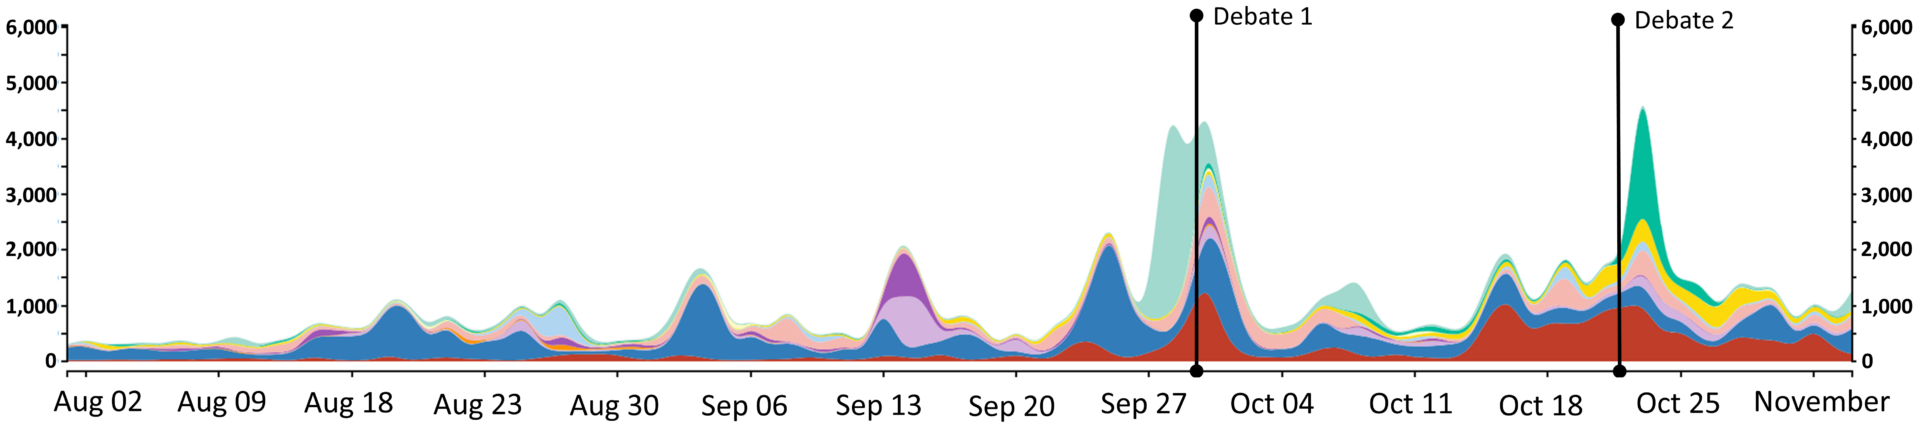
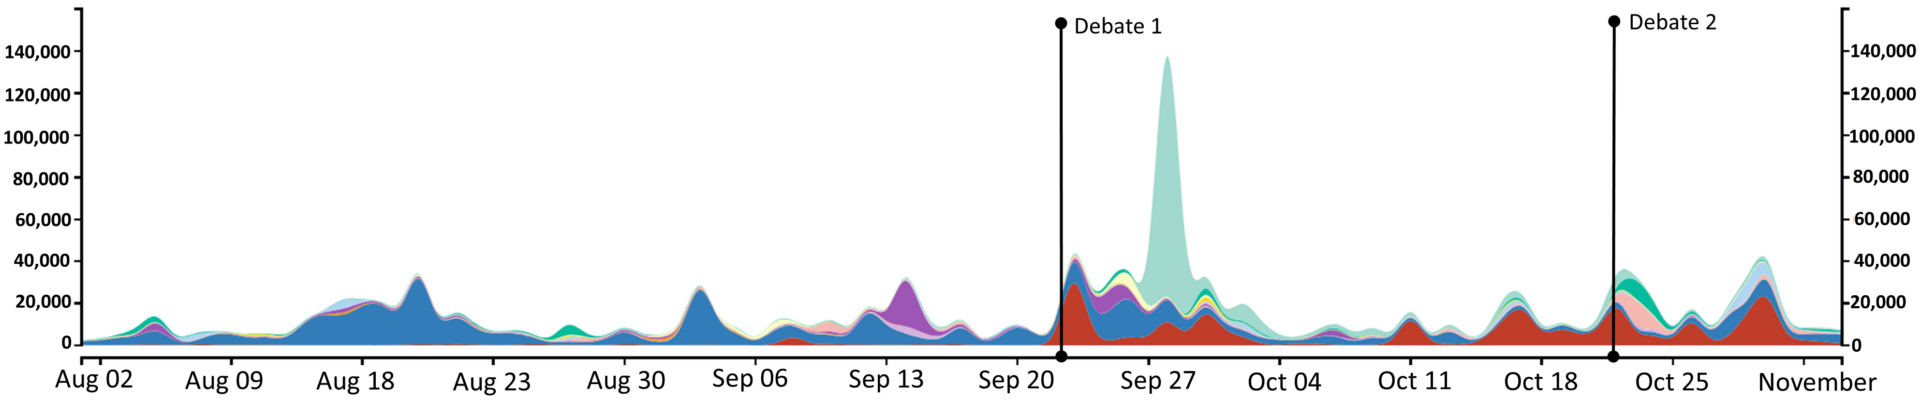
Finding 6: Twitter misinformation centered on election integrity when mentioning Trump and on personal attacks when mentioning Biden.
Trump-related misinformation discussion on Twitter15Due to the short-text nature of social media, the candidate the tweeter is focusing on can easily be identified through keyword matching. We analyzed tweets and surveys separately for each candidate to avoid loss of precision (see Methods section). was heavily concentrated in the election integrity topic (at 40.0%), followed by Biden personal attacks (18.5%) and taxes (16.5%; see Appendix B, Table 2 for detail). The first two switched places in tweets about Biden: A heavy concentration mentioned the Biden personal attacks topic (76.5%), followed distantly by election integrity (7.8%) and military (4.2%).16The Trump and Biden Twitter streams were the least correlated pair of media sources we analyzed, ranging from a low of 0.01 for election integrity (p > 0.10) to a high of 0.46 for racism (p < 0.001). Correlations for Biden personal attacks were significantly higher when mentions in the Biden stream were set to lag behind mentions in the Trump stream by one day (0.60 for a one-day lag vs. 0.45 for same-day mentions, p < 0.001). A similar pattern was observed for other issues, suggesting that some misinformation may have emerged in Trump-related conversations on Twitter before diffusing to Biden-related Twitter. Figures 5 and 6 show how these numbers changed over time. As in other streams, after the first debate, Biden personal attacks grew to 36.9% and 86.4% of misinformation in Trump- and Biden-related conversation, respectively (compared to 9.3% and 62.1% before the debates; see Table 2), while election integrity shrunk to 21.1% and 4.7%, respectively (compared to 48.7%and 9.9%).17The influence of the debates on Twitter discourse was less pronounced for other topics. As Figure 5 shows, the taxes topic surged before the first debate for Trump Twitter (growing from 18.1% to 23.6% and then declining; see Table 2) and much less so for Biden Twitter (see Figure 6), while Biden Twitter saw a crest for the military topic before and after the first debate and for climate in early October. The more frequent, less coordinated spikes in Figures 5 and 6 relative to those in newspapers and TV suggest a freer spread of misinformation on social media—and an apparently less coherent influence of political debates in this media stream.
Finding 7: Public recollections about the candidates reflected misinformation dominant in the media.
Election integrity dominated survey respondents’ recollections of Trump but not Biden (accounting for 76.6% of misinformation-related topics and 2.70% of respondents for Trump, vs. 5.85% and 0.21%, respectively, for Biden), while Biden personal attacks crowded out any other memorable misinformation-related topics for Biden but not Trump (at 82.2% of misinformation and 2.92% of respondents for Biden, vs. 13.2% and 0.46%, respectively, for Trump; see Appendix B, Table 1 for complete numbers).18Other common misinformation-related topics also resurfaced in surveys: taxes and racism grew among Trump recollections around the first and second debates, respectively (reaching 1.02% and 0.61% of respondents), while military and racism crested in Biden recollections around the first and second debates, respectively (reaching 0.27% and 0.25% of respondents). Figures 7 and 8 show how these trends varied over time. While Biden personal attacks topped out during the week of the second debate (mentioned by over 10% of respondents) and then slowly declined, election integrity peaked in mid-August19Misinformation related to election integrity was likely brought to prominence relatively early due to then-President Trump’s tweets. Testing this hypothesis is beyond the scope of this paper and will be the focus of future work. (mentioned by over 9% of respondents) and surged just before the election. This suggests that political leaders (e.g., Trump) may push misinformation to secure partisan votes when the electoral outcome is uncertain—a strategic appeal similar to emphasizing divisive issues like abortion (Glaeser et al., 2005).
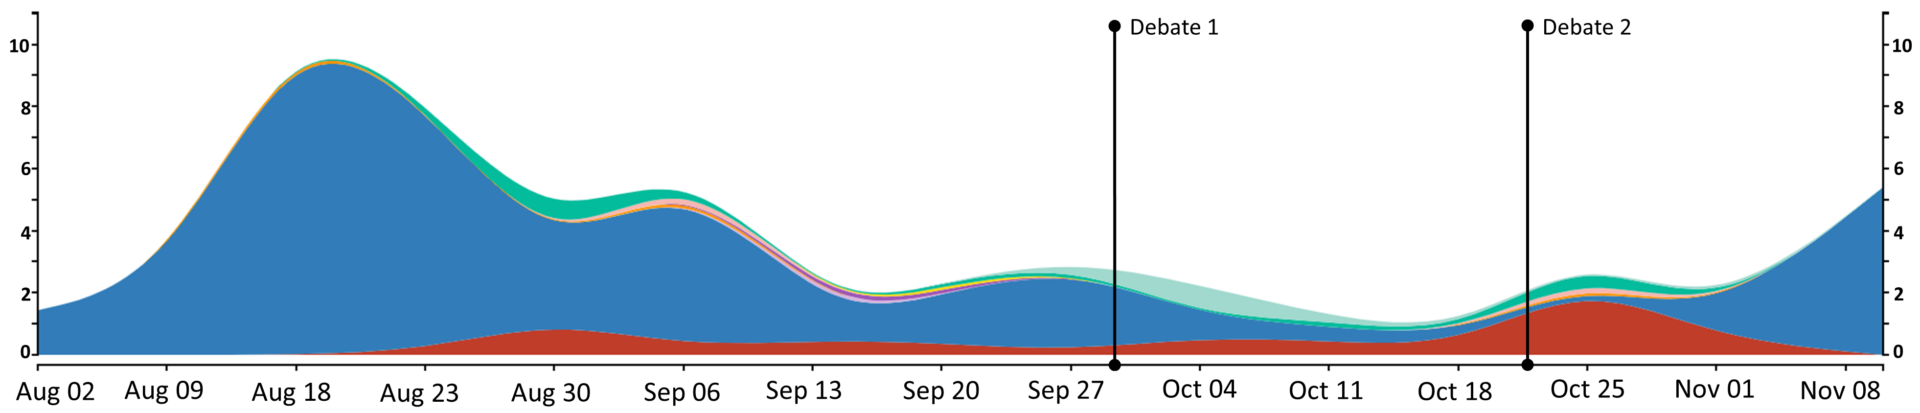
A similar pattern is observed for Biden personal attacks (comparing the sky-blue curves in Figures 7 and 8). This topic was the most correlated topic for surveys, ranging from 0.54 for the correlation of Biden surveys and Trump surveys (p < 0.05) to 0.92 for that of surveys and newspapers (p < 0.001).20For Biden personal attacks, correlations show that surveys led Twitter by a week to the same extent as on the same day: their contemporaneous correlation is 0.78, while their one-week lead is 0.75 and their one-week lag is 0.31 (p < 0.001 for all but the lag). In the same way but on a somewhat smaller scale, Biden surveys led Trump surveys for this topic (0.54 vs 0.55 vs. 0.34 for contemporaneous vs. one-week lead vs. one-week lag; p < 0.05 for all but the lag). Moreover, similar to the media streams, misinformation in both sets of survey results shifted toward Biden personal attacks after the first debate, growing to 28.9% in Trump surveys and 89.9% in Biden surveys. This suggests that multiple media streams echoed this line of attack and may have allowed the debates to reinforce this impression later in the campaign. Moreover, while both top topics showed staying power or “continuing influence” (Johnson & Seifert, 1994; Lewandowsky et al., 2012), the later climax of Biden personal attacks—a relatively new storyline when it emerged during the first debate to gain a wide audience—suggests that novel information can carry extra weight (Morley & Walker, 1987) for both the media engaging with misinformation and the public remembering it.21In comparison, the influence of Trump’s debate claims about election integrity myths may have been limited by their familiarity. The struggle for public attention may have motivated more coordinated messaging by the Trump campaign, possibly explaining the growth in recollection of this misinformation-related topic in the week before the election.
Methods
We examined the relationships between political influence, media coverage, and misinformation by studying which misleading statements by presidential candidates during debates gained traction during the campaign season. To understand the presence of false claims across modes of communication, we compared the prevalence of misinformation-related content across six streams of data between August 1 and November 3, a period spanning both debates in the 2020 U.S. presidential election cycle. These streams included traditional television and newspaper media, tweets mentioning each of the candidates’ names, and open-ended survey data asking Americans what they had recently read, seen, or heard about each of the candidates. We also asked which misinformation-related topics made an impression on the public and what distinguished these from topics that did not become salient.
Across all streams, we tracked terms related to misleading or fallacious claims candidates made during at least one of the two debates and categorized them into 14 topics. We identified false and misleading statements by either candidate during the presidential debates using several reputable fact checkers: Snopes (snopes.com), PolitiFact (politifact.com), and The Washington Post (washingtonpost.com/news/fact-checker). We then traced the spread of these false and misleading statements from August 1 to November 3, 2020, using Twitter, newspapers, and television. A strength of our analysis is the scale and diversity of the media streams studied.
We used the coverage of the three fact checkers to create an initial list of misleading or false statements made by the candidates during the debates (excluding partially true statements), amounting to 35 statements from the first debate and 17 statements from the second. We placed these statements into categories or topics, developed phrase lists specific to each misleading statement,22To create a phrase list, we mixed distinctive words and synonyms within each phrase to capture the main topic of a given misleading statement while minimizing overlap with similar but unrelated statements. For instance, to capture the myth that “the California forest fires were caused by forest mismanagement,” we included phrases such as “forest management,” “forest floor,” and “clean your floors.” While some phrases have broader connotations than the specific myth at hand, their contextual meaning was rarely off-topic because we selected only posts or articles that also included a candidate’s name. We demonstrate this precision with a dictionary validation study in Appendix F. and used these phrases to identify relevant discussion from August 1 to November 3, 2020. Appendix A describes our misinformation themes and shows example phrases. We used the number of mentions to track misinformation-related topics in our streams at the unit level: articles, TV segments, Twitter posts, or surveys. The first three were measured daily while surveys were collected weekly.
Although our phrases target specific false claims—allowing for high precision in identifying mentions of the claims—our topics are intended to capture misinformation conversation more broadly, including both statements that promote and statements that refute a false claim.23Misinformation discussion contains both false and factual claims, one often motivating and providing context for the other. We focused on explicit false claims where possible; for the taxes topic, however, conflation of facts with lies motivated us to instead capture the full, contested discussion. The New York Times report that broke the news about Trump paying $750 in taxes in 2016 and 2017 also included a Trump organization lawyer’s false claim that Trump had paid millions in taxes (Buettner et al., 2020). To capture the competition between these positions often concealed by the short format of social media, we sought to capture both the factual and false aspects of their interchange by using phrases such as “750 in taxes” together with phrases like “paid millions in taxes.” Moreover, each topic has a different balance of factual and false claims, and these may vary by media stream. For instance, our phrases similar to “750 in taxes” account for about 99% of Trump Twitter content related to taxes. However, the less frequent (and less diverse) phrases similar to “Trump paid millions of dollars in taxes” followed the same pattern as above (see Figure 5), surging on September 28, 2020—from zero to 1,134 mentions—and persisting at low–moderate levels until the election. The correlation between these phrases and the overall taxes topic is very high at 0.959 (p < 0.001). This supports our expectation that, within our contested topics, dueling factual and false claims rise and fall together in similar proportions. Our validation, described in Appendix F, suggests that our dictionary-based method does indeed capture myths for our most and least common misinformation-related topics, with minimal contamination by factual dialogue using similar language (e.g., discussion of California forest fires in the context of climate change).24We validated our dictionary-based method using three of the most common misinformation-related topics (climate change, Biden personal attacks, and election integrity) and three of the least common ones (healthcare, taxes, and military) on social media. The results thus support the validity of our approach both for our most central, enduring topics and for those that were short-lived (see Appendix F).
We also performed correlation analysis (lagging, contemporaneous, and leading) to describe how tightly connected streams were to one another. Our results thus include the following measures for a given topic and point in time: the number of mentions in a given media stream, the proportion of misinformation contributed to a given media stream, and the correlations between a given pair of media streams. We used each of these measures in our analysis.25For the full list of frequencies (number of mentions) proportions contributed by a given topic to a given stream, see Appendix B, Table 2. For our full results on correlations between streams, see Appendix E. These analytical steps and our supplemental analyses26See Appendix C for analysis of topics’ spread using the proportion of sources (newspapers and TV channels), rather than mentions, that discuss a given misinformation-related topic. See Appendix D for breakdowns of media organizations by partisan leaning and selected regions. provided a precise signal of misinformation presence across media streams and allowed us to differentiate topics by their success in gaining public salience.
We did not combine Trump- and Biden-related tweets or surveys to prevent loss of measurement precision. Specifically, while newspaper and television streams often focus on both candidates in the same article or segment, tweets and surveys were contributed for specific candidates (through hashtags or interview questions). In other words, analyzing Trump tweets and surveys separately from Biden tweets and surveys avoids distorting candidate-specific patterns and provides a more nuanced analysis. Below we describe our sampling and data collection approach for each of our data sources.
Newspapers
We collected 186,551 articles containing the keywords “Biden” or “Trump” from 308 newspapers around the country using the EventRegistry API. We initially manually identified a total of 750 local, national, and national newspapers, ensuring we had at least two newspapers from every state (with more papers for larger states). The API gave us access to 308 newspapers from our initial sample.
Television
We obtained 24/7 closed caption transcripts from 1,246 television channels with news programming from TVEyes. The data is broken down into 5- to 10-minute segments determined by advertising. We identified segments that referred to the U.S. presidential election or their candidates using the words “election,” “Trump,” and “Biden,” allowing us to look at the daily frequency of the misinformation-related topics.
We used the Twitter API to collect tweets containing either the “Biden” or “Trump” keyword, yielding 62,343,263 and 107,410,289 tweets, respectively.27Tweets that contain both “Biden” and “Trump” are in both individual sets. We shortened some phrases in our dictionary (e.g., “Hunter” instead of “Hunter Biden”) to count mentions of myths in the context of tweets that specifically referenced candidate names. Our minimal preprocessing removed punctuation and capitalization and expanded contractions.28Because we relied on manually derived keywords and phrases to identify misinformation in a social media environment rife with informal language (e.g., abbreviations and slang), our analysis likely fails to capture many variations on our misinformation themes of interest. As such, the findings above likely underrepresent the extent of false and misleading conversation on Twitter.
Surveys
We collected 17,800 telephone surveys from July 1, 2020, to November 10, 2020, among a nationwide, random sample of approximately 1,000 adults per week via the SSRS Omnibus survey. The surveys used were part of The Breakthrough. Surveys were conducted over a six-day period each week, typically between Tuesday and Sunday, in English and Spanish. Roughly 70% of surveys each week were completed with respondents reached via cellphone. Each respondent was asked, “What, if anything, have you heard, read, or seen in the past few days about Donald Trump?” and “What, if anything, have you heard, read, or seen in the past few days about Joe Biden?” The order in which the two questions were asked was randomized so that some respondents were asked about Trump first and others were asked about Biden first. Exact responses to these questions were transcribed by interviewers. As with Twitter, we used a modified misinformation dictionary (with shorter phrases more typical of spoken language) to count how many survey respondents freely recalled our misinformation-related topics.29The full list of additional phrases we used to track misleading statements on surveys is available on our project repository. See the file “Additional Survey Phrases.xlsx.”
Topics
Bibliography
Allcott, H., Gentzkow, M., & Yu, C. (2019). Trends in the diffusion of misinformation on social media. Research & Politics, 6(2). https://doi.org/10.1177/2053168019848554
Allport, F. H., & Lepkin, M. (1945). Wartime rumors of waste and special privilege: Why some people believe them. The Journal of Abnormal and Social Psychology, 40(1), 3–36. https://doi.org/10.1037/h0058110
Ampofo, L., Anstead, N., & O’Loughlin, B. (2011). Trust, confidence, and credibility. Information, Communication & Society, 14(6), 850–871. https://doi.org/10.1080/1369118X.2011.587882
Bartels, L. M. (1996). Uninformed votes: Information effects in presidential elections. American Journal of Political Science, 40(1), 194–230. https://doi.org/10.2307/2111700
Barthel, M., Mitchell, A., & Holcomb, J. (2016, December 15). Many Americans believe fake news is sowing confusion. Pew Research Center. https://www.pewresearch.org/journalism/2016/12/15/many-americans-believe-fake-news-is-sowing-confusion/
Benoit, W. L., & Hansen, G. J. (2004). Presidential debate watching, issue knowledge, character evaluation, and vote choice. Human Communication Research, 30(1), 121–144. https://doi.org/10.1111/j.1468-2958.2004.tb00727.x
Bode, L., & Vraga, E. K. (2015). In related news, that was wrong: The correction of misinformation through related stories functionality in social media. Journal of Communication, 65(4), 619–638. https://doi.org/10.1111/jcom.12166
Boykoff, M. T., & Boykoff, J. M. (2004). Balance as bias: Global warming and the US prestige press. Global Environmental Change, 14(2), 125–136. https://doi.org/10.1016/j.gloenvcha.2003.10.001
Budak, C. (2019, May 13). What happened? The spread of fake news publisher content during the 2016 U.S. presidential election. The World Wide Web Conference (WWW ’19), 139–150. https://doi.org/10.1145/3308558.3313721
Budak, C., Goel, S., & Rao, J. M. (2016). Fair and balanced? Quantifying media bias through crowdsourced content analysis. Public Opinion Quarterly, 80(S1), 250–271. https://doi.org/10.1093/poq/nfw007
Buettner, R., Craig, S., & McIntire, M. (2020, September 27). Trump’s taxes show chronic losses and years of income tax avoidance. The New York Times. https://www.nytimes.com/interactive/2020/09/27/us/donald-trump-taxes.html
Chan, M. S., Jones, C. R., Hall Jamieson, K., & Albarracín, D. (2017). Debunking: A meta-analysis of the psychological efficacy of messages countering misinformation. Psychological Science, 28(11), 1531–1546. https://doi.org/10.1177/0956797617714579
Chaffee, S. H. (1978). Presidential debates—Are they helpful to voters? Communication Monographs, 45(4), 330–346. https://doi.org/10.1080/03637757809375978
Chen, E., Chang, H., Rao, A., Lerman, K., Cowan, G., & Ferrara, E. (2021). COVID-19 misinformation and the 2020 U.S. presidential election. Harvard Kennedy School (HKS) Misinformation Review, 1(7). https://doi.org/10.37016/mr-2020-57
Clarke, C. E. (2008). A question of balance: The autism-vaccine controversy in the British and American elite press. Science Communication, 30(1), 77–107. https://doi.org/10.1177/1075547008320262
Ecker, U. K. H., Lewandowsky, S., Swire, B., & Chang, D. (2011). Correcting false information in memory: Manipulating the strength of misinformation encoding and its retraction. Psychonomic Bulletin & Review, 18(3), 570–578. https://doi.org/10.3758/s13423-011-0065-1
Eveland, W. P. (2001). The cognitive mediation model of learning from the news: Evidence from nonelection, off-year election, and presidential election contexts. Communication Research, 28(5), 571–601. https://doi.org/10.1177/009365001028005001
Fandos, N. (2020, September 23). Republican inquiry finds no evidence of wrongdoing by Biden. The New York Times. https://www.nytimes.com/2020/09/23/us/politics/biden-inquiry-republicans-johnson.html
Festinger, L. (1957). A theory of cognitive dissonance. Stanford University Press.
Gershkoff, A., & Kushner, S. (2005). Shaping public opinion: The 9/11–Iraq connection in the Bush administration’s rhetoric. Perspectives on Politics, 3(3), 525–537. https://doi.org/10.1017/s1537592705050334
Glaeser, E. L., Ponzetto, G. A., & Shapiro, J. M. (2005). Strategic extremism: Why Republicans and Democrats divide on religious values. The Quarterly Journal of Economics, 120(4), 1283–1330. https://doi.org/10.1162/003355305775097533
Graham, M. H. (2020). Self-awareness of political knowledge. Political Behavior, 42(1), 305–326. https://doi.org/10.1007/s11109-018-9499-8
Grimmer, J., & Stewart, B. M. (2013). Text as data: The promise and pitfalls of automatic content analysis methods for political texts. Political Analysis, 21(3), 267–297. https://doi.org/10.1093/pan/mps028
Guillory, J. J., & Geraci, L. (2013). Correcting erroneous inferences in memory: The role of source credibility. Journal of Applied Research in Memory and Cognition, 2(4), 201–209. https://doi.org/10.1016/j.jarmac.2013.10.001
Hallin, D. C. (1992). Sound bite news: Television coverage of elections, 1968–1988. Journal of Communication, 42(2), 5–24. https://doi.org/10.1111/j.1460-2466.1992.tb00775.x
Hasher, L., Goldstein, D., & Toppino, T. (1977). Frequency and the conference of referential validity. Journal of Verbal Learning and Verbal Behavior, 16(1), 107–112. https://doi.org/10.1016/s0022-5371(77)80012-1
Hochschild, J. L., & Einstein, K. L. (2015). Do facts matter?: Information and misinformation in American politics. University of Oklahoma Press.
Iyengar, S., & Hahn, K. S. (2009). Red media, blue media: Evidence of ideological selectivity in media use. Journal of Communication, 59(1), 19–39. https://doi.org/10.1111/j.1460-2466.2008.01402.x
Jang, S. M., & Pasek, J. (2015). Assessing the carrying capacity of Twitter and online news. Mass Communication and Society, 18(5), 577–598. https://doi.org/10.1080/15205436.2015.1035397
Jerit, J., & Barabas, J. (2006). Bankrupt rhetoric: How misleading information affects knowledge about social security. Public Opinion Quarterly, 70(3), 278–303. https://doi.org/10.1093/poq/nfl010
Jerit, J., & Zhao, Y. (2020). Political misinformation. Annual Review of Political Science, 23(1), 77–94. https://doi.org/10.1146/annurev-polisci-050718-032814
Johnson, H. M., & Seifert, C. M. (1994). Sources of the continued influence effect: When misinformation in memory affects later inferences. Journal of Experimental Psychology: Learning, Memory, and Cognition, 20(6), 1420–1436. https://doi.org/10.1037/0278-7393.20.6.1420
Kuklinski, J. H., Quirk, P. J., Jerit, J., Schwieder, D., & Rich, R. F. (2000). Misinformation and the currency of democratic citizenship. The Journal of Politics, 62(3), 790–816. https://doi.org/10.1111/0022-3816.00033
Kunda, Z. (1990). The case for motivated reasoning. Psychological Bulletin, 108(3), 480–498. https://doi.org/10.1037/0033-2909.108.3.480
Lazer, D. M. J., Baum, M. A., Benkler, Y., Berinsky, A. J., Greenhill, K. M., Menczer, F., Metzger, M. J., Nyhan, B., Pennycook, G., Rothschild, D., Schudson, M., Sloman, S. A., Sunstein, C. R., Thorson, E. A., Watts, D. J., & Zittrain, J. L. (2018). The science of fake news. Science, 359(6380), 1094–1096. https://doi.org/10.1126/science.aao2998
Lemert, J. B. (1993). Do televised presidential debates help inform voters? Journal of Broadcasting & Electronic Media, 37(1), 83–94. https://doi.org/10.1080/08838159309364205
Lewandowsky, S., Ecker, U. K. H., & Cook, J. (2017). Beyond misinformation: Understanding and coping with the “post-truth” era. Journal of Applied Research in Memory and Cognition, 6(4), 353–369. https://doi.org/10.1016/j.jarmac.2017.07.008
Lewandowsky, S., Ecker, U. K. H., Seifert, C. M., Schwarz, N., & Cook, J. (2012). Misinformation and its correction: Continued influence and successful debiasing. Psychological Science in the Public Interest, 13(3), 106–131. https://doi.org/10.1177/1529100612451018
Lipset, S. M. (1960). Political man: The social bases of politics. Doubleday.
Lodge, M., & Taber, C. S. (2013). The rationalizing voter. Cambridge University Press.
Maurer, M., & Reinemann, C. (2006). Learning versus knowing: Effects of misinformation in televised debates. Communication Research, 33(6), 489–506. https://doi.org/10.1177/0093650206293252
McGrew, S., Breakstone, J., Ortega, T., Smith, M., & Wineburg, S. (2018). Can students evaluate online sources? Learning from assessments of civic online reasoning. Theory & Research in Social Education, 46(2), 165–193. https://doi.org/10.1080/00933104.2017.1416320
Morley, D. D., & Walker, K. B. (1987). The role of importance, novelty, and plausibility in producing belief change. Communication Monographs, 54(4), 436–442. https://doi.org/10.1080/03637758709390243
Morris, E.-J., & Fonrouge, G. (2020, October 14). Smoking-gun email reveals how Hunter Biden introduced Ukrainian businessman to VP dad. New York Post. https://nypost.com/2020/10/14/email-reveals-how-hunter-biden-introduced-ukrainian-biz-man-to-dad/
Mosleh, M., Martel, C., Eckles, D., & Rand, D. G. (2021). Perverse downstream consequences of debunking: Being corrected by another user for posting false political news increases subsequent sharing of low quality, partisan, and toxic content in a Twitter field experiment. Proceedings of the 2021 CHI Conference on Human Factors in Computing Systems. https://doi.org/10.1145/3411764.3445642
Neuman, W. R. (1986). The paradox of mass politics: Knowledge and opinion in the American electorate. Harvard University Press.
Nyhan, B., Porter, E., Reifler, J., & Wood, T. J. (2020). Taking fact-checks literally but not seriously? The effects of journalistic fact-checking on factual beliefs and candidate favorability. Political Behavior, 42(3), 939–960. https://doi.org/10.1007/s11109-019-09528-x
Nyhan, B., & Reifler, J. (2010). When corrections fail: The persistence of political misperceptions. Political Behavior, 32(2), 303–330. https://doi.org/10.1007/s11109-010-9112-2
Page, B. I., & Shapiro, R. Y. (1992). The rational public: Fifty years of trends in Americans’ policy preferences. University of Chicago Press.
Pasek, J., Sood, G., & Krosnick, J. A. (2015). Misinformed about the Affordable Care Act? Leveraging certainty to assess the prevalence of misperceptions. Journal of Communication, 65(4), 660–673. https://doi.org/10.1111/jcom.12165
Scheufele, D. A., & Krause, N. M. (2019). Science audiences, misinformation, and fake news. Proceedings of the National Academy of Sciences, 116(16), 7662–7669. https://doi.org/10.1073/pnas.1805871115
Schwarz, N., Sanna, L. J., Skurnik, I., & Yoon, C. (2007). Metacognitive experiences and the intricacies of setting people straight: Implications for debiasing and public information campaigns. In Advances in Experimental Social Psychology (Vol. 39, pp. 127–161). Academic Press. https://doi.org/10.1016/S0065-2601(06)39003-X
Shapiro, R. Y., & Bloch‐Elkon, Y. (2008). Do the facts speak for themselves? Partisan disagreement as a challenge to democratic competence. Critical Review, 20(1-2), 115–139. https://doi.org/10.1080/08913810802316373
Shoemaker, P. J., & Vos, T. (2009). Gatekeeping theory. Routledge.
Soroka, S. N. (2012). The gatekeeping function: Distributions of information in media and the real world. The Journal of Politics, 74(2), 514–528. https://doi.org/10.1017/s002238161100171x
Stecula, D. A., Kuru, O., & Jamieson, K. H. (2020). How trust in experts and media use affect acceptance of common anti-vaccination claims. Harvard Kennedy School (HKS) Misinformation Review, 1(1). https://doi.org/10.37016/mr-2020-007
Stecula, D. A., & Pickup, M. (2021). How populism and conservative media fuel conspiracy beliefs about COVID-19 and what it means for COVID-19 behaviors. Research & Politics, 8(1). https://doi.org/10.1177/2053168021993979
Stroud, N. J. (2010). Polarization and partisan selective exposure. Journal of Communication, 60(3), 556–576. https://doi.org/10.1111/j.1460-2466.2010.01497.x
Swire-Thompson, B., DeGutis, J., & Lazer, D. (2020). Searching for the backfire effect: Measurement and design considerations. Journal of Applied Research in Memory and Cognition, 9(3), 286–299. https://doi.org/10.1016/j.jarmac.2020.06.006
Van Duyn, E., & Collier, J. (2019). Priming and fake news: The effects of elite discourse on evaluations of news media. Mass Communication and Society, 22(1), 29–48. https://doi.org/10.1080/15205436.2018.1511807
Vargo, C. J., & Guo, L. (2017). Networks, big data, and intermedia agenda setting: An analysis of traditional, partisan, and emerging online US news. Journalism & Mass Communication Quarterly, 94(4), 1031–1055. https://doi.org/10.1177/1077699016679976
Vargo, C. J., Guo, L., & Amazeen, M. A. (2018). The agenda-setting power of fake news: A big data analysis of the online media landscape from 2014 to 2016. New Media & Society, 20(5), 2028–2049. https://doi.org/10.1177/1461444817712086
Vosoughi, S., Roy, D., & Aral, S. (2018). The spread of true and false news online. Science, 359(6380), 1146–1151. https://doi.org/10.1126/science.aap9559
Walter, N., & Murphy, S. T. (2018). How to unring the bell: A meta-analytic approach to correction of misinformation. Communication Monographs, 85(3), 423–41. https://doi.org/10.1080/03637751.2018.1467564
Weaver, K., Garcia, S. M., Schwarz, N., & Miller, D. T. (2007). Inferring the popularity of an opinion from its familiarity: A repetitive voice can sound like a chorus. Journal of Personality and Social Psychology, 92(5), 821. https://doi.org/10.1037/0022-3514.92.5.821
Wood, T., & Porter, E. (2019). The elusive backfire effect: Mass attitudes’ steadfast factual adherence. Political Behavior, 41(1), 135–163. https://doi.org/10.1007/s11109-018-9443-y
Yang, A., Shin, J., Zhou, A., Huang-Isherwood, K. M., Lee, E., Dong, C., Kim, H. M., Zhang, Y., Sun, J., Li, Y., Nan, Y., Zhen, L., & Liu, W. (2021). The battleground of COVID-19 vaccine misinformation on Facebook: Fact checkers vs. misinformation spreaders. Harvard Kennedy School (HKS) Misinformation Review, 2(4). https://doi.org/10.37016/mr-2020-78
Zaller, J. R. (1992). The nature and origins of mass opinion. Cambridge University Press.
Funding
This research is funded by National Science Foundation awards #1934925 and #1934494, the Fritz Family Fellowship, and the Massive Data Institute (MDI) at Georgetown University. Thanks to these funders for supporting this research.
Competing Interests
None.
Ethics
Our Twitter data is subject to an IRB exemption at Georgetown University (study number STUDY00000579). Our newspaper and TV data did not involve human subjects and therefore were not subject to IRB approval. Misinformation was labeled by team members. We did not use Mechanical Turk or other paid data labeling services for this study.
Copyright
This is an open access article distributed under the terms of the Creative Commons Attribution License, which permits unrestricted use, distribution, and reproduction in any medium, provided that the original author and source are properly credited.
Data Availability
To generate structured variables—including work frequencies, topics, and sentiment—based on the raw data analyzed here, we invite researchers to request permission through the Georgetown Massive Data Institute Analytic portal (https://portals.mdi.georgetown.edu/). Information to assist in reproducing our analysis is available in our GitHub repository (https://github.com/GU-DataLab/misinformation-2020_presidential_debates). However, we are not allowed to give access to raw Twitter data, television transcripts, newspaper data, or surveys given the terms of usage.
Acknowledgements
We would like to thank the MDI staff and the members of the Georgetown University DataLab for their support. We especially thank Rebecca Vanarsdall at Georgetown for coordinating data labeling. We would also like to thank the anonymous reviewers for the detailed and thoughtful reviews.