Peer Reviewed
Research note: This photograph has been altered: Testing the effectiveness of image forensic labeling on news image credibility
Article Metrics
6
CrossRef Citations
PDF Downloads
Page Views
Despite the ubiquity of images and videos in online news environments, much of the existing research on misinformation and its correction is solely focused on textual misinformation, and little is known about how ordinary users evaluate fake or manipulated images and the most effective ways to label and correct such falsities. We designed a visual forensic label of image authenticity, Picture-O-Meter, and tested the label’s efficacy in relation to its source and placement in an experiment with 2440 participants. Our findings demonstrate that, despite human beings’ general inability to detect manipulated images on their own, image forensic labels are an effective tool for counteracting visual misinformation.

Research Questions
- How do image forensic labels showing the integrity (or lack thereof) of news images influence Internet users’ credibility evaluation of these images?
- How does the placement of image forensic labels affect users’ credibility perceptions of images? Are labels more effective when they are shown directly alongside the image (concurrent labeling), or after the fact (post-exposure labeling)?
- Does the source of image forensic labels matter? Would people trust software-generated labels more so than expert- or crowd-generated labels?
Research note Summary
- In a series of online experiments, 2,440 participants from Amazon’s MTurk saw photoshopped news images and rated these images’ credibility. These images depicted various socio-political issues and were accompanied by a brief caption on simulated web and social media platforms such as Facebook and Twitter.
- Most participants saw the image with a forensic label showing that the image was either “Altered” or “Un-altered.” The purported source of the label was either “software,” “experts,” or “other people on the Internet.” The forensic label was placed either together with the image (concurrent placement) or after the image was viewed (post-exposure placement).
- Forensic labels are effective: Participants who saw images with an “Altered” label rated the image less credible than those who saw an “Un-altered” label or no label at all.
- Participants with higher digital media literacy were more skeptical of image credibility; images that aligned with participants’ pre-existing issue attitude were more likely to be perceived as credible.
- We did not find a continued influence effect of visual misinformation: Placing the labels concurrently with the image was as effective as placing them shortly after showing the image. Source effects were also mixed: “software” influenced participants’ credibility judgments more than “human” when placed after image exposure, and “human” was more influential than “software” when placed concurrently with the image.
Implications
Despite the ubiquity of images and videos in today’s online environments, much of the existing research on misinformation and its correction strategies is solely focused on textual misinformation. Even though some studies have focused on image-oriented social media platforms such as Instagram, they are primarily concerned with the veracity of textual information embedded in images, rather than the images themselves (Vraga et al., 2020). Little is known about how ordinary users process and evaluate fake or manipulated images in online news environments, and strategies to effectively counteract such falsities. As digital image creation and manipulation technology become increasingly advanced and accessible, the potential harmful consequences of visual misinformation cannot be overstated or ignored.
We argue that users process and perceive visual misinformation fundamentally differently than text-based misinformation. Visuals are detected and processed very quickly by the human brain (Potter et al., 2014). They are more easily remembered, shared, and are often more persuasive than words. According to Dual Coding Theory (Clark & Paivio, 1991), visual information is processed independently from verbal (textual) information. While the perceptual features of visual information are similar or analogous to the events they depict, the relationship between words and their meanings is arbitrary. Empirical research has shown that imagery along with textual information produced better recall and memory of a message than the text alone (Clark & Paivio, 1991; Paivio & Csapo, 1973). On social media, news posts containing images capture individuals’ attention more than those without any visuals (Keib et al., 2018), prompting more clicks and more user engagement (Li & Xie, 2020). Posts containing images are also more likely to go viral (Heimbach et al., 2015). Further, empirical evidence suggests that visual portrayals in news reporting have powerful framing effects, influencing audience perception of political figures (Peng, 2018) as well as opinions and behavioral intentions regarding political issues, much more so than text alone (Powell et al., 2015). Taken together, visual information’s superior impression, retention, virality, and persuasiveness all warrant special consideration from misinformation researchers.
This study addresses this critical gap. It demonstrates that image forensic labels are an effective means of correcting visual misinformation. Inspired by the Truth-O-Meter from Politifact (www.politifact.com), a widely-used fact-checking website, we developed a visual barometer conveying forensic analysis of image integrity and veracity. We then tested the barometer’s efficacy in relation to the source and placement of the forensic analysis in a series of online experiments with 2,440 participants on MTurk. Our experiment reaffirmed previous findings that most human beings are unable to detect manipulated images on their own (Shen et al., 2019). Yet, carefully designed forensic labels can be a promising correction strategy in our battle against visual misinformation.
Two features of our study are noteworthy. First, it focuses solely on photographic images typically presented in a news context while excluding explicitly synthetic images such as cartoons, infographics, or internet memes. This is because, unlike text, photographic images are believed to capture unedited truth. By contrast, synthetic images are more akin to text—they are expected to be created and heavily edited by designers and journalists. Second, this study is the first to test the efficacy of image forensic labels, which are qualitatively different from fact-checking labels typically associated with textual misinformation. Most misinformation research to date focuses on the latter, which assesses the veracity of a claim and provides factual information should the claim be false. Forensic image analysis assesses the integrity of the image itself. It evaluates whether the content of the photographic image has been altered or manipulated. In other words, forensic image analysis does not evaluate the veracity of textual information accompanying the image in the news context or other well-studied credibility indicators such as source and virality metrics (Lin, Spence & Lachlan, 2016; Yaqub et al., 2020). Therefore, image forensic labels provide an additional, critical signal of credibility evaluation, over and above other credibility cues already available to users. Furthermore, in the current post-truth environment, text and other credibility indicators (such as source) are often perceived with strong partisan biases (Mitchell et al., 2014), thus limiting their efficacy. With a strict focus on image integrity, image forensic labels are non-partisan and effective across the board.
The most important takeaway from this study is that image forensic labels, in the form of a simple Picture-O-Meter, are effective in influencing credibility perception of images. Specifically, participants who saw an “Altered” label perceived the image to be less credible than those who saw either an “Un-altered” label or no label for the same image. In other words, people assume news images capture unedited truth, and they have to be persuaded otherwise. This finding is robust across various image content, news source, and virality metrics. Consistent with past research (Kasra et al., 2018; Nightingale et al., 2017), our study again suggests that human beings are incapable of detecting doctored images. Yet, a simple and non-partisan forensic label like the Picture-O-Meter could make a considerable difference in our battle against misinformation. The forensic label strictly reveals whether an image is manipulated or not. It does not perform a fact check, which is costly and is often perceived as partisan. Almost all news platforms can adopt such an image forensic evaluation tool without worrying about partisan bias typically associated with specific news sources and fact-checking services. Unlike the prevalent correction strategies used primarily targeting textual misinformation, our labels were offered without any additional reason or explanation (other than that the image was considered “Altered” or “Un-altered” by either experts, other people on the internet, or software). We do not yet know if more explanations about how these forensic labels are derived would further enhance the labels’ efficacy, and future studies should investigate this possibility. In addition, image forensic labels on platforms can be an excellent education tool, as image integrity is now separated from other credibility signals such as text and original news sources. They can lend legitimacy to news images and help the public more critically examine visuals online.
Our finding further supports the critical importance of digital media literacy in the fight against misinformation. Participants with higher digital media literacy in general and digital photography experience specifically were more skeptical of image credibility. This means that interventions to boost digital media literacy could improve discernment of visual misinformation. There is some initial evidence showing the efficacy of such interventions (Guess et al., 2020), although these interventions are primarily focused on textual misinformation at the moment. Scholars and platforms should invest in developing programs and interventions that aim to improve visual digital literacy. We also found that images that aligned with participants’ pre-existing issue attitude were more likely to be perceived as credible, consistent with “confirmation bias” found in prior research (Knobloch-Westerwick et al., 2015; Shen et al., 2019). Taken together, these findings suggest considerable individual differences in their susceptibility to visual misinformation, some of which can be potentially mitigated through media literacy interventions, while others are more enduring and issue-specific. This suggests that public agencies, educators, and platforms can use media literacy and issue-attitude to identify individuals susceptible to specific kinds of visual misinformation. Such susceptibility profiles can be created using a combination of self-reports and digital footprints such as browse and share history. These profiles can then be used for targeted inoculation and correction efforts.
We did not find a “continued influence effect,” contradicting some existing research that misinformation perceptions may persist despite correction (Lewandowsky et al., 2012; Walter & Tukachinsky, 2019). This could be partially attributed to our research design, as participants in the post-exposure condition saw the forensic label only a few minutes after seeing the image, so the misbelief may not be strong enough to linger. Source effects were also mixed: “software” worked better than “human” (either “experts” or “other people online”) when placed after image exposure, and “human” worked better than “software” when placed concurrently with the image. Our findings diverge from another study focused on textual headlines, which found that fact-checking labels produced by humans (fact-checkers) worked better than those from software (Yaqub et al., 2020). This discrepancy might suggest that users think humans are more capable than machines in identifying textual misinformation, but much less so in spotting visual misinformation. Taken together, our results represent an initial step in understanding what roles placement and source of forensic labels may play in counteracting visual misinformation, but significant nuances remain to be uncovered in future research.
In sum, we propose the following recommendations:
- Media organizations and platforms should develop and adopt forensic labels attached to news images to combat visual misinformation. These forensic labels are simple, non-partisan, and easy to implement, and are effective on their own without providing further explanations. They also enhance digital media literacy by helping the public consume visuals more critically.
- Media organizations and platforms should invest in interventions to boost digital media literacy, especially visual literacy. They could identify individuals susceptible to specific misinformation content and design targeted prevention and correction efforts.
- We call for more research to examine the placement and source effects on the efficacy of image forensic labels. Due to visual’s unique properties, visual misinformation and its correction strategies need to be systematically tested.
Findings
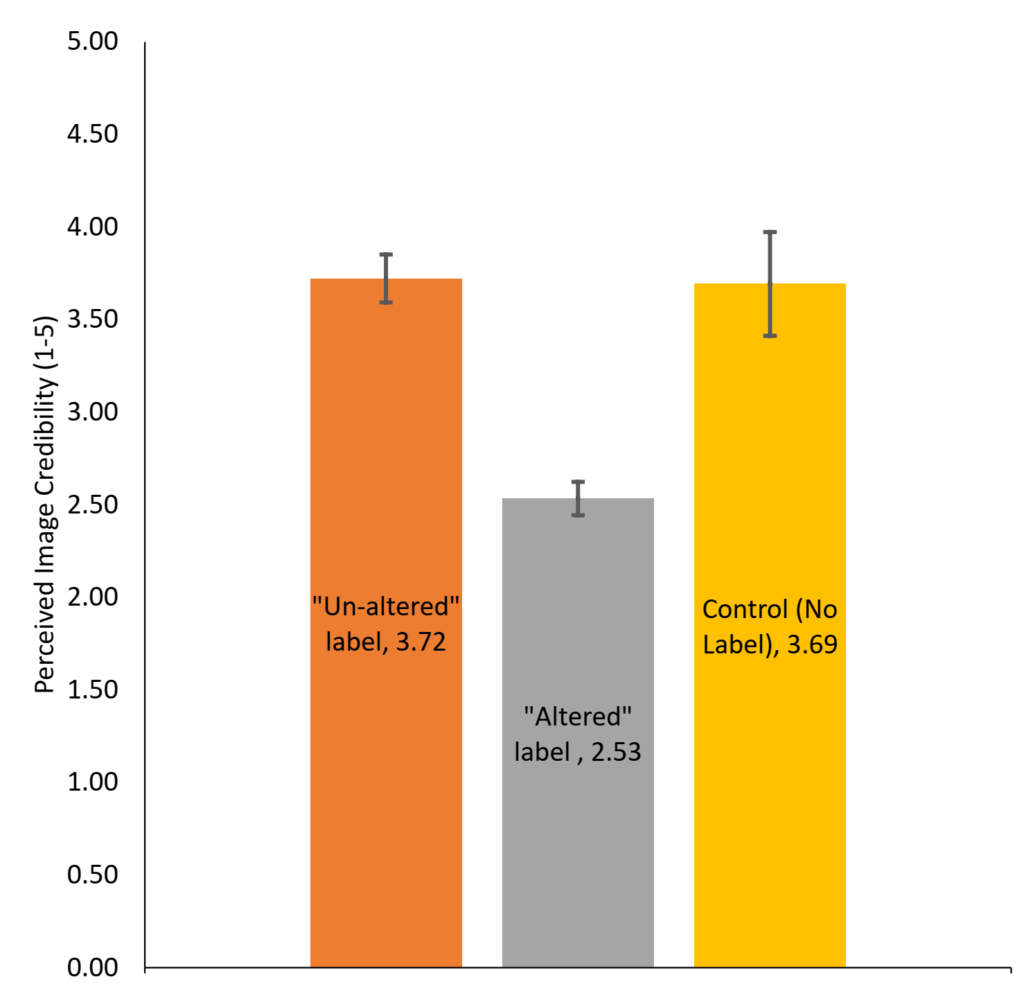
Finding 1: Image forensic labels are effective: Participants who saw either no label or an “Un-altered” label rated the image more credible than those who saw an “Altered” label for the same image.
We found that image forensic labels are a highly effective tool in swaying participants’ credibility evaluation of images. Participants who were exposed to a forensic label showing an image was “Altered” rated the image 1.16 points less credible than those who did not see a label. By contrast, participants who viewed a forensic label of “Un-altered” rated the image just as credible as those who did not see a label. Our finding is highly robust across different images and credibility cues (e.g., number of likes and shares, whether the source was reputable such as New York Times) and after controlling for covariates in a follow-up analysis of covariance (see Appendix).
Our finding suggests that by default, people assume images are credible in online news environments, and they have to be persuaded otherwise. A simple forensic label like the Picture-O-Meter could make a considerable difference in credibility evaluation.
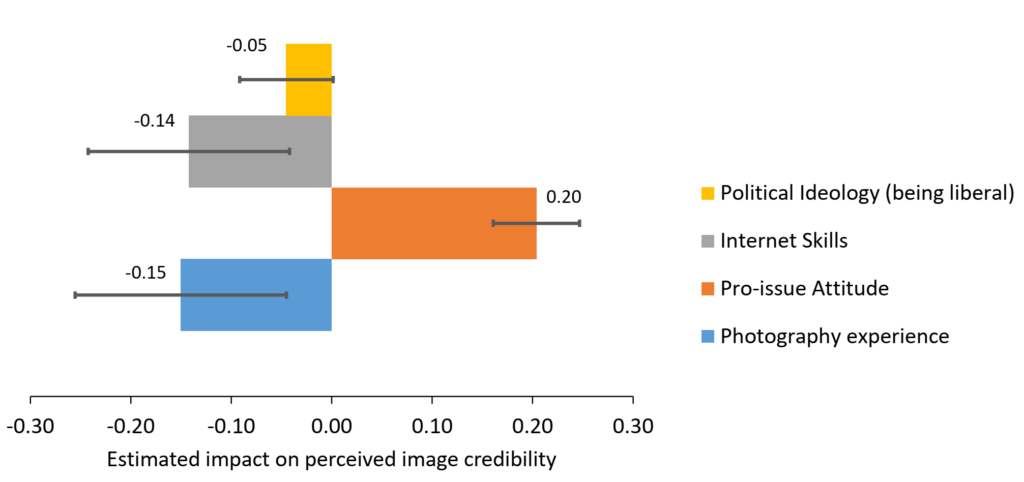
Finding 2: a) Participants with higher digital media literacy were more skeptical of image credibility; b) Images that align with participants’ pre-existing issue attitude were more likely to be perceived as credible.
We found that image credibility evaluations differed considerably with participants’ individual characteristics. People’s prior experience with digital imaging and photography has a significant and negative association with credibility ratings (B = -0.15, p = .005), so did people’s internet skills (B = -0.14, p = .005). Their pre-existing attitude supporting the issue depicted in the image showed a significant and positive association with credibility (B = 0.20, p < .001). Participant’s pre-existing political affiliation also mattered. People who self-identified as more liberal on the political spectrum tended to rate image credibility lower, although that association was marginally significant (B = – 0.05, p = .06). Participants’ self-reported age and gender were not associated with how they rated credibility of these images.
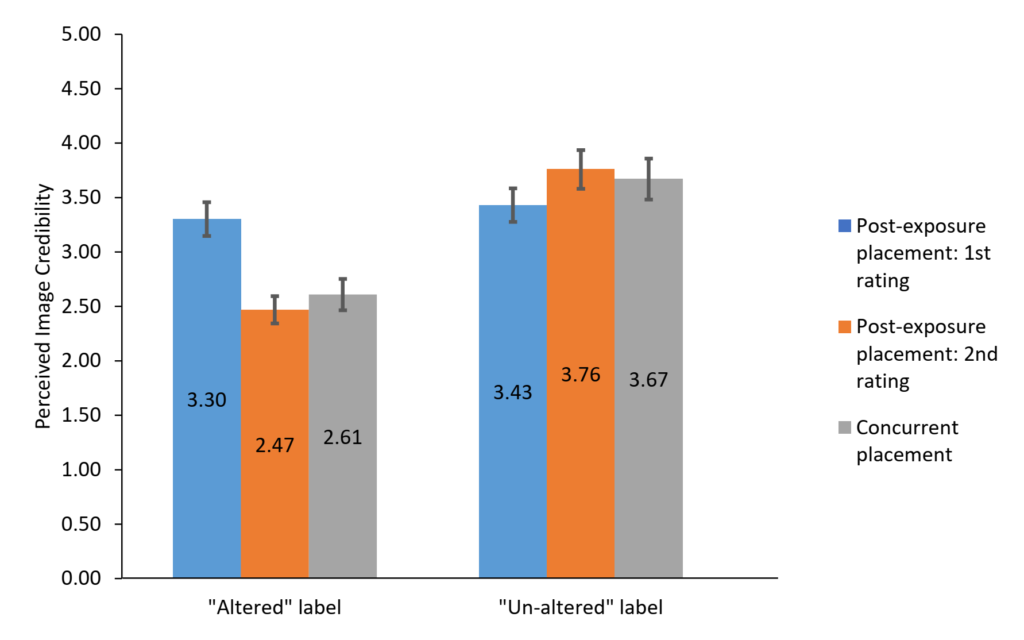
Finding 3: We did not find a continued influence effect of visual misinformation: Placing the labels concurrently with the image was as effective as placing them after showing the image.
Participants assigned to the post-exposure condition saw and rated the image credibility first, then were shown the forensic label, and rated the image again. Their second rating was significantly higher than the first rating for those who saw the “Un-altered” label, Mdifference = 0.33, t(531) = 6.88, p < .001, and significantly lower than the first rating for those who saw the “altered” label, Mdifference = -0.83, t(517) = -14.98, p < .001, suggesting that the label was effective. Their second rating of image credibility was statistically equivalent to those of the concurrent condition [participants exposed to the “Altered” label, F(1, 978) = 1.96, p =.16; participants exposed to the “Un-altered” label, F(1, 1000) = 0.39, p = .53, suggesting an absence of the continued influence effect. In other words, perceptions of visual misinformation dissipated with the forensic label.
Taken together, our finding is in direct contrast to previous research showing that misinformation belief tends to linger despite correction efforts (Walter & Tukachinsky, 2019). The discrepancy might be due to 1) the nature of visual information, 2) the single exposure of the visual misinformation before the forensic label, and 3) the relatively short time lag between participants’ credibility ratings before and after seeing the forensic label. More research is needed to test whether there is continued influence of visual misinformation with repeated exposure and longer time lags between exposure and correction.
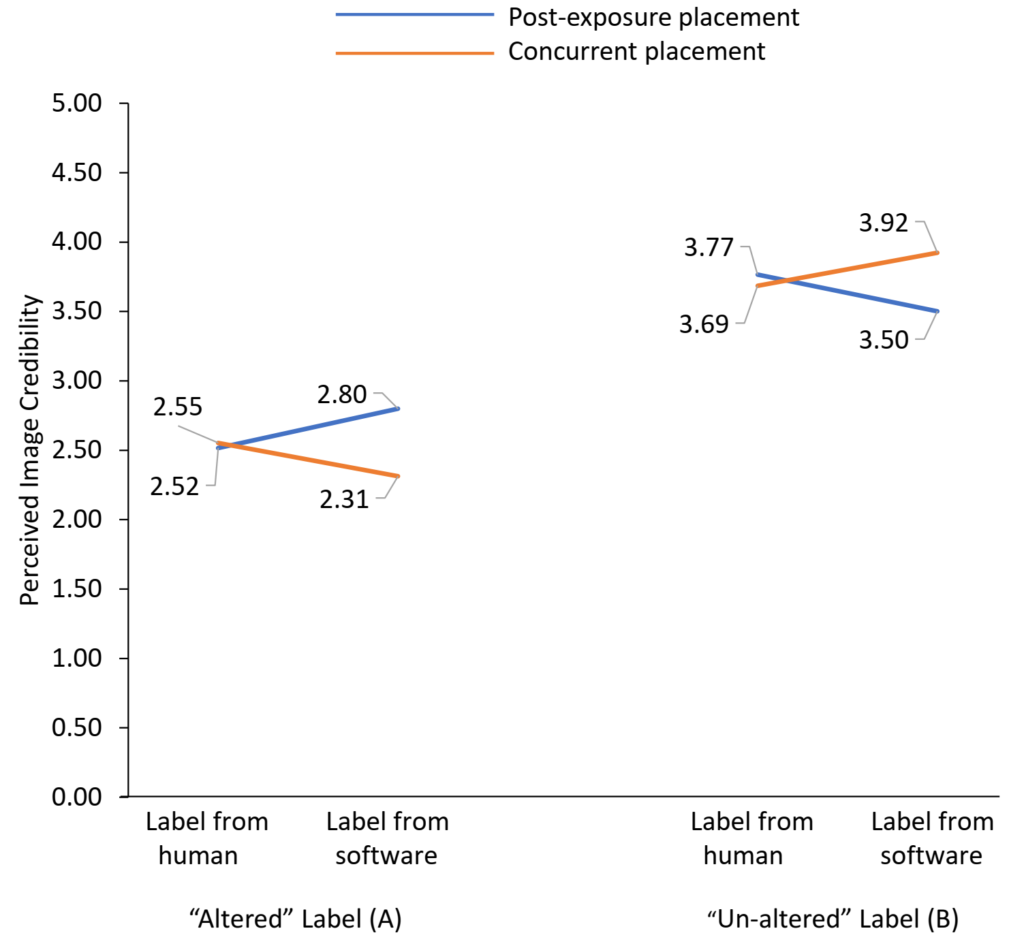
Finding 4: As sources of image forensic labels, “software” worked better than “human” when placed after image exposure, and “human” worked better than “software” when placed concurrently with the image.
The three sources of image forensic analysis (“experts,” “other people online,” and “software”) did not significantly differ from each other (see Appendix). After consolidating the “experts” and “other people online” categories into a “human” category, our exploratory analysis found significant interaction between forensic label source (label coming from either “human” or “software”) and label placement (concurrent vs. post-exposure) (see Figure 4). Specifically, if the “Altered” forensic label came from software instead of humans (either experts or other people online), the label was more effective in reducing perceived credibility in post-exposure condition than in concurrent exposure condition. Similarly, if the “Un-altered” label came from software instead of humans, it was more effective in increasing perceived credibility in post-exposure condition, as compared to the concurrent exposure condition. In other words, “software” as a labeling source seems to amplify the label’s effect if placed after the image was seen, while “humans” as a labeling source was more effective when placed concurrently with the image.
Methods
We designed a partial factorial experiment with three factors: image forensic label (“Un-altered” / “Altered” / No label) X source of forensic label (Expert / Other people online / Software) X placement of forensic label (post-exposure/concurrent exposure/control—no forensic analysis), resulting in 13 unique conditions for each image tested (see Table 1).
Additionally, we included two other factors—image credibility cues (high/low) and image content (three unique images)—which were manipulated across all conditions, bringing the total number of experimental cells to 78 (see Appendix). For each image, we included a one-line textual caption to simulate how people typically consume images in online news environments (see Figure 5). To make sure no participants had prior exposure to our stimuli, all three images and their captions were fake: They were purposefully cropped, changed, and combined (for more information on stimuli creation, see Shen et al., 2019).
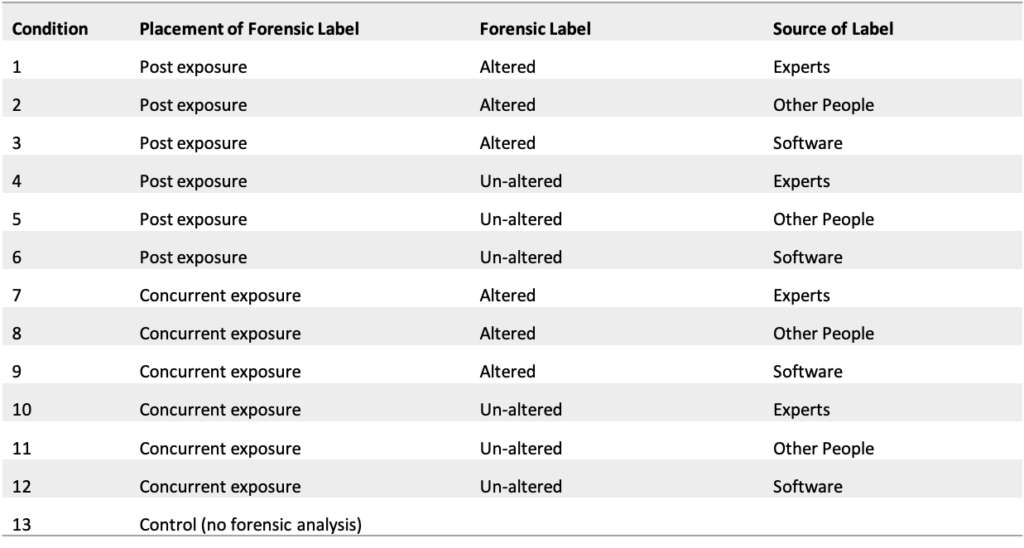
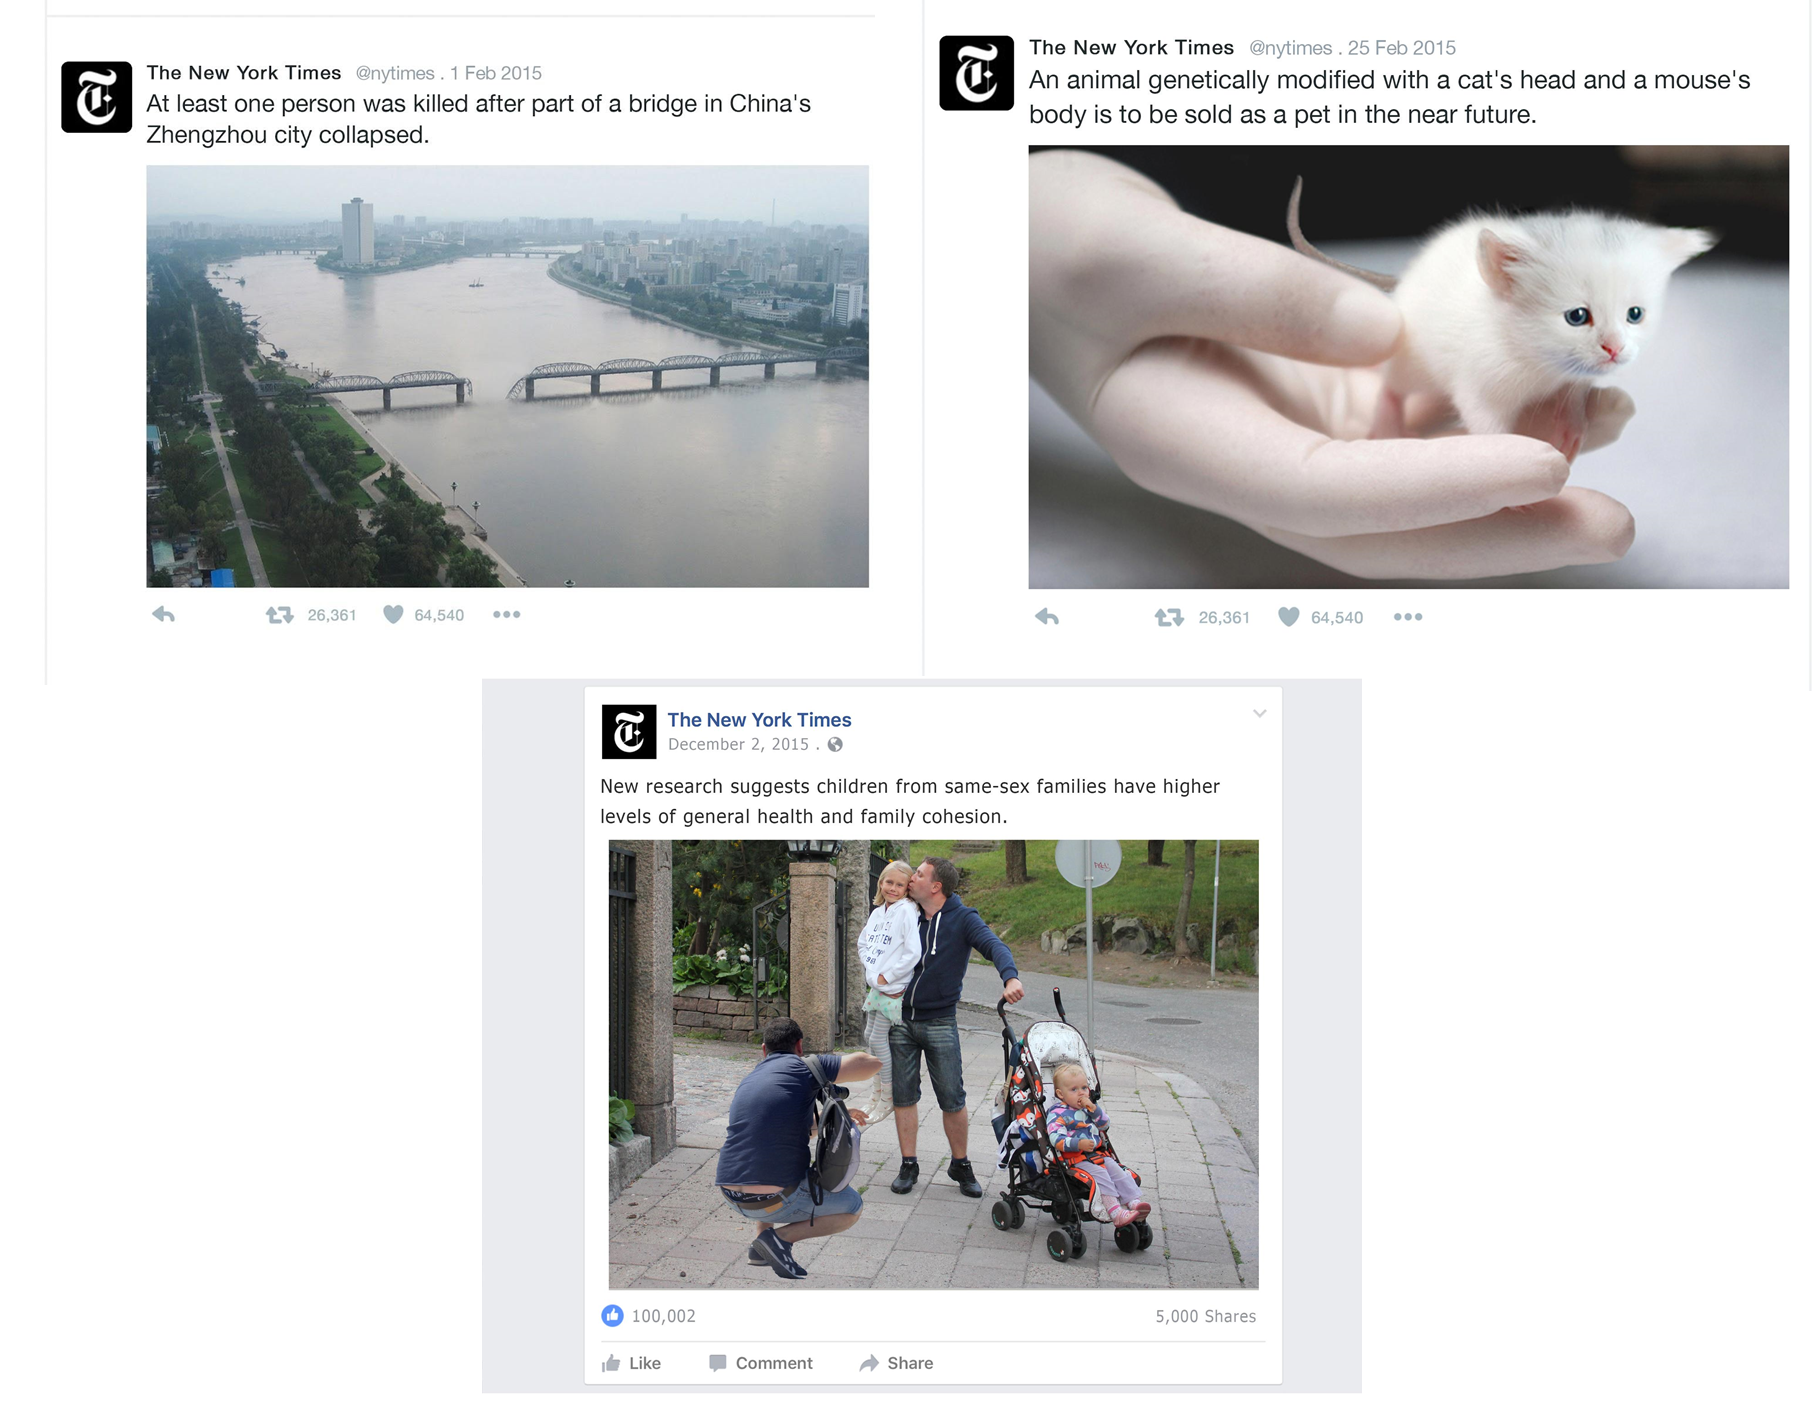
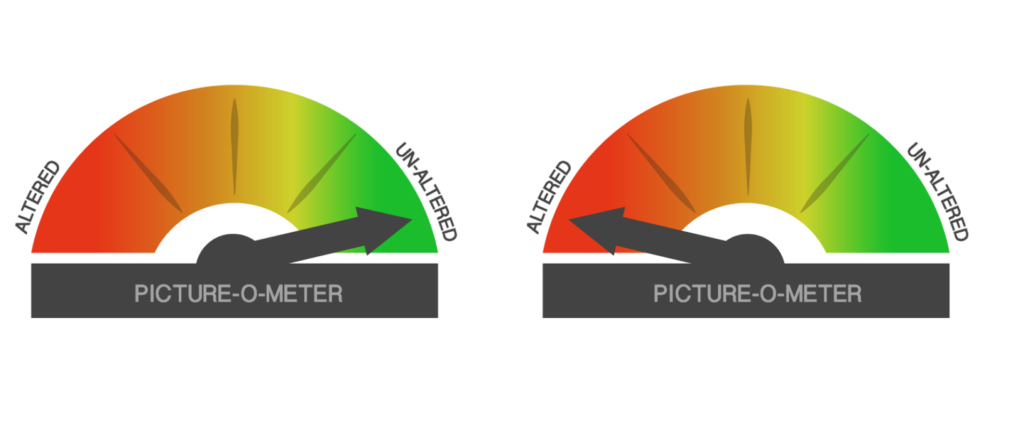
Image forensic label. Inspired by the fact-checking website Politifact’s veracity barometer, “Truth-O-Meter,” we designed a visually similar barometer (Picture-O-Meter) to convey image forensic information. To make the barometer as unambiguous as possible, there were only two labels on the barometer, “Un-altered” and “Altered” (see Figure 6), with a short description accompanying the barometer: “UN-ALTERED: The picture is original and untouched” or “ALTERED: The picture is fake and manipulated.” A qualitative user assessment with a few college undergraduates showed that Picture-O-Meter was clear and easy to understand.
Source of forensic analysis. We manipulated the purported source of image forensic analysis by presenting a short description alongside the Picture-O-Meter: “The Picture-O-Meter indicates the level of authenticity of the photo as rated by experts on detecting photo editing and manipulation (software for detecting photo editing and manipulation; other people on the internet)” (emphasis original). The “experts” and “other people” categories were later merged into a “human” category in analysis (see Appendix).
Placement of forensic analysis. In the post-exposure placement condition, participants saw and rated the image first without any forensic analysis information (first rating), then they answered other questions before seeing the same image accompanied by forensic analysis shown in the picture-o-meter on the same screen, and rated its credibility again (second rating). These two credibility tests were kept as distant from each other as possible in the survey experiment. In the concurrent placement condition, the forensic label was shown on the same screen as the image itself. Participants only had one opportunity to evaluate the credibility of the image. In the control condition, participants saw the image once and rated its credibility, without any forensic label.
Participants were recruited from Mechanical Turk (www.mturk.com) and were redirected to Qualtrics to complete a survey study. The experiment was conducted in three consecutive batches, each featuring one image, within a 6-week period in 2017. The control condition (Condition 13, n = 157) was taken from the user sample of a previous study (Shen et al., 2019), while participants in Conditions 1–12 were recruited anew. Participants were only exposed to one image in the study, and could complete the study only once.
Participants first read the consent form and confirmed to proceed to one of the twelve randomly assigned experimental conditions (Conditions 1–12) on Qualtrics. Since some questions required knowledge of U.S. politics, participants who were younger than 18, resided outside of the United States, or had participated in our previous studies were excluded after the initial screening questions. To ensure consistent image dimensions, we instructed participants on a mobile device to switch to a laptop or desktop computer before proceeding to the questions or they would be excluded from the study.
Participants first answered questions about their internet skills and political attitude, then evaluated the credibility of an image, and finally answered questions on demographics. To make sure enough attention was paid to the image itself, participants could not proceed until 30 seconds had lapsed on that screen. For those who were assigned to the post-exposure label condition and had to evaluate the credibility of the same image twice, these two evaluations were placed in the survey as distant from each other as possible. The survey study took about 5 minutes to complete, and all participants were paid $0.25 for the task.
A total of 2,814 participants from MTurk attempted to participate in the study, among which 2,440 completed the main questions (86.71%). There were 1,817 (74.5%) participants who identified as White/Caucasian, 225 (9.2%) as African American, 150 (6.1%) as Hispanic, 160 (6.6%) as Asian, 17 (0.7%) as Native American, 9 (0.4%) as Pacific Islander, 46 (1.9%) as other race, and 16 (0.7%) who did not disclose their race. A total of 1,065 (43.6%) identified as male, 1,363 (55.9%) as female, and 12 (0.5%) did not close their gender. The median age was 27 years old (M = 29.72). Thirteen (0.5%) had less than a high school education, 243 (10.0%) completed high school or a GED, 618 (25.3%) had some college, 274 (11.2%) had a 2-year college degree, 896 (36.4%) had a 4-year college degree, and 15.2% had a doctoral or professional degree. The median income category was $50,000-$59,999. Compared to the 2019 U.S. Census (U.S. Census Bureau, 2019), the study sample had slightly more women, white/Caucasian, and Asian than in the general U.S. population. For detailed information on measures and analysis, please refer to Appendix.
Topics
Bibliography
Clark, J. M., & Paivio, A. (1991). Dual coding theory and education. Educational Psychology Review, 3(3), 149–210. https://doi.org/10.1007/BF01320076
Flanagin, A. J., & Metzger, M. J. (2007). The role of site features, user attributes, and information verification behaviors on the perceived credibility of web-based information. New Media & Society, 9(2), 319–342. https://doi.org/10.1177/1461444807075015
Greer, J. D., & Gosen, J. D. (2002). How much is too much? Assessing levels of digital alteration of factors in public perception of news media credibility. Visual Communication Quarterly, 9(3), 4–13. https://doi.org/10.1080/15551390209363485
Guess, A. M., Lerner, M., Lyons, B., Montgomery, J. M., Nyhan, B., Reifler, J., & Sircar, N. (2020). A digital media literacy intervention increases discernment between mainstream and false news in the United States and India. Proceedings of the National Academy of Sciences, 117(27), 15536–15545. https://doi.org/10.1073/pnas.1920498117
Hargittai, E., & Hsieh, Y. P. (2012). Succinct survey measures of web-use skills. Social Science Computer Review, 30(1), 95–107. https://doi.org/10.1177%2F0894439310397146
Heimbach, I., Schiller, B., Strufe, T., & Hinz, O. (2015). Content virality on online social networks: Empirical evidence from Twitter, Facebook, and Google+ on German news websites. Proceedings of the 26th ACM Conference on Hypertext & Social Media (pp. 39–47). Association for Computing Machinery. https://doi.org/10.1145/2700171.2791032
Kasra, M., Shen, C., & O’Brien, J. F. (2018). Seeing is believing: How people fail to identify fake images on the web. Extended Abstracts of the 2018 CHI Conference on Human Factors in Computing Systems (pp. 1–6). Association for Computing Machinery. http://dx.doi.org/10.1145/3170427.3188604
Keib, K., Espina, C., Lee, Y.-I., Wojdynski, B. W., Choi, D., & Bang, H. (2018). Picture this: The influence of emotionally valanced images, on attention, selection, and sharing of social media news. Media Psychology, 21(2), 202–221. https://doi.org/10.1080/15213269.2017.1378108
Knobloch-Westerwick, S., Johnson, B. K., & Westerwick, A. (2015). Confirmation bias in online searches: Impacts of selective exposure before an election on political attitude strength and shifts. Journal of Computer-Mediated Communication, 20(2), 171–187. https://doi.org/10.1111/jcc4.12105
Lewandowsky, S., Ecker, U. K. H., Seifert, C. M., Schwarz, N., & Cook, J. (2012). Misinformation and its correction: Continued influence and successful debiasing. Psychological Science in the Public Interest, 13(3), 106–131. https://doi.org/10.1177%2F1529100612451018
Li, Y., & Xie, Y. (2020). Is a picture worth a thousand words? An empirical study of image content and social media engagement. Journal of Marketing Research, 57(1), 1–19. https://doi.org/10.1177%2F0022243719881113
Lin, X., Spence, P. R., & Lachlan, K. A. (2016). Social media and credibility indicators: The effect of influence cues. Computers in Human Behavior, 63, 264–271. https://doi.org/10.1016/j.chb.2016.05.002
Mitchell, A., Gottfried, J., Kiley, J., & Masta, K. E. (2014). Political polarization & media habits. Pew Research Center: Journalism and Media. http://www.journalism.org/2014/10/21/political-polarization-media-habits/#trust-and-distrust-liberals-trust-many-conservatives-trust-few
Nightingale, S. J., Wade, K. A., & Watson, D. G. (2017). Can people identify original and manipulated photos of real-world scenes? Cognitive Research: Principles and Implications, 2(1), 30. https://doi.org/10.1186/s41235-017-0067-2
Paivio, A., & Csapo, K. (1973). Picture superiority in free recall: Imagery or dual coding? Cognitive Psychology, 5(2), 176–206. https://doi.org/10.1016/0010-0285(73)90032-7
Peng, Y. (2018). Same candidates, different faces: Uncovering media bias in visual portrayals of presidential candidates with computer vision. Journal of Communication, 68(5), 920–941. https://doi.org/10.1093/joc/jqy041
Potter, M. C., Wyble, B., Hagmann, C. E., & McCourt, E. S. (2014). Detecting meaning in RSVP at 13 ms per picture. Attention, Perception, & Psychophysics, 76(2), 270–279. https://doi.org/10.3758/s13414-013-0605-z
Powell, T. E., Boomgaarden, H. G., De Swert, K., & de Vreese, C. H. (2015). A clearer picture: The contribution of visuals and text to framing effects. Journal of Communication, 65(6), 997–1017. https://doi.org/10.1111/jcom.12184
Shen, C., Kasra, M., Pan, W., Bassett, G. A., Malloch, Y., & O’Brien, J. F. (2019). Fake images: The effects of source, intermediary, and digital media literacy on contextual assessment of image credibility online. New Media & Society, 21(2), 438–463. https://doi.org/10.1177%2F1461444818799526
Treier, S., & Hillygus, D. S. (2009). The nature of political ideology in the contemporary electorate. The Public Opinion Quarterly, 73(4), 679–703. https://doi.org/10.1093/poq/nfp067
Vraga, E. K., Kim, S. C., Cook, J., & Bode, L. (2020). Testing the effectiveness of correction placement and type on Instagram. The International Journal of Press/Politics, 25(4), 632–652. https://doi.org/10.1177%2F1940161220919082
U.S. Census Bureau (2019). Population estimates, July 1, 2019. https://www.census.gov/quickfacts/fact/table/US/PST045219
Walter, N., & Tukachinsky, R. (2019). A meta-analytic examination of the continued influence of misinformation in the face of correction: How powerful is it, why does it happen, and how to stop it? Communication Research, 47(2), 155–177. https://doi.org/10.1177%2F0093650219854600
Yaqub, W., Kakhidze, O., Brockman, M. L., Memon, N., & Patil, S. (2020). Effects of credibility indicators on social media news sharing intent. Proceedings of the 2020 CHI Conference on Human Factors in Computing Systems (pp. 1–14). Association for Computing Machinery. https://doi.org/10.1145/3313831.3376213
Funding
This research was supported by National Science Foundation awards CNS-1444840 and CNS-1444861.
Competing Interests
The author(s) declared no potential conflicts of interest with respect to the research, authorship, and/or publication of this article.
Ethics
The research protocol was approved by the institutional review board at University of California. Human subjects gave informed consent at the beginning of the web survey before participating.
Copyright
This is an open access article distributed under the terms of the Creative Commons Attribution License, which permits unrestricted use, distribution, and reproduction in any medium, provided that the original author and source are properly credited.
Data Availability
All materials needed to replicate this study are available via the Harvard Dataverse: https://doi.org/10.7910/DVN/CTJTLT
Acknowledgements
The authors thank Grace Bassett, Wenjing Pan, and Yining Malloch for their research assistance.