Peer Reviewed
Engaging with others: How the IRA coordinated information operation made friends
Article Metrics
CrossRef Citations
PDF Downloads
Page Views
We analyzed the Russian Internet Research Agency’s (IRA) 2015–2017 English-language information operation on Twitter to understand the special role that engagement with outsiders (i.e., non-IRA affiliated accounts) played in their campaign. By analyzing the timing and type of engagement of IRA accounts with non-IRA affiliated accounts, and the characteristics of the latter, we identified a three-phases life cycle of such engagement, which was central to how this IRA network operated. Engagement with external accounts was key to introducing new troll accounts, to increasing their prominence, and, finally, to amplifying the messages these external accounts produced.

Research Questions
- How prevalent (i.e., common) are retweets and replies between non-IRA affiliated accounts (outsiders) and IRA-affiliated accounts (insiders) during the 2015-2017 IRA information operation?
- How did the prevalence of such interactions vary over time?
- What are the characteristics of accounts outside the operation that engaged with insiders and are targeted for replies and retweets?
Essay Summary
- We use data from Twitter to identify the timing and targets of retweets and replies external to the IRA network (i.e., networked output) in order to infer the role these actions played in the IRA’s campaign.
- We found that the portion of the IRA network expressing identity-group oriented persona went through a three-phases life cycle: introduction, growth, and amplification. Differences in the use of networked output help define these three phases.
- In the introductory period, the IRA networks reply to prominent accounts in the networks they wish to join at high rates. In the growth period, they establish reputations as content producers, through a nearly equal mix of external retweets and “original content,” while increasing follower counts throughout that period. Finally, in the amplification period they retweet external accounts at very high rates.
- The IRA amplified over 100k accounts, some multiple times. These were mostly relatively small, unverified, accounts that were ideologically aligned with the persona of the retweeting IRA account.
Implications
The Russian-government-affiliated IRA was central in a Russian effort to sow discord among the US electorate, largely through social media, during and after the 2016 Presidential election. IRA trolls engaged extensively with external, non-troll accounts on Twitter from 2015 through 2017, by replying to and retweeting those outsiders. This activity is an example of what we call networked output, defined as an action that includes making a connection to some other user. Networked output can be internal or external to a user’s existing network. It may also entail additional content, such as some output from that user (as in the case of a retweet), or some commentary from the networking account (as in a quote-tweet or reply). Networked output may serve several functions beyond the obvious repetition of a given message including (1) forming a connection with an individual user, (2) efficiently communicating a greater volume of messaging, (3) amplifying the original poster, and (4) signaling acceptance or rejection of the original poster. Work to date has analyzed the content produced by the IRA accounts, but has mostly been interested in accounts external to the troll network either as a way of inferring the operation’s strategy and who might be affected by it (Bail et al., 2020; Stewart et al., 2018; Freelon & Lokot, 2020) or in measuring the extent that outsiders shared IRA content (Badaway et al., 2018). Far from being passive users useful only as an audience for troll content, or as vectors for sharing it with others, external accounts were, in fact, an additional tool to be employed. Our findings suggest that these external accounts were central to every stage of the operation’s operation, from introduction, to growth, and, finally, to a stage in which amplification of external accounts was an important, possibly even central, IRA goal. This research supports Starbird et al.’s (2019) observation regarding the importance of considering “the role of online crowds (unwitting and otherwise) in spreading disinformation and political propaganda” (p. 4).
We show that the networked output of the IRA Twitter accounts was homophilic, both within and external to the network. Linvill and Warren (2020) show that the IRA accounts were specialized by theme. The IRA-operated accounts linked to external accounts that shared a theme with the account doing the linking. Right Trolls, for example, retweeted and replied to other accounts that shared the anti-immigrant and pro-Trump ideology that the troll account was presenting. Left Trolls, similarly, linked to accounts that were politically left and, more specifically, often identified as black activists.
The external behavior varied over the life of the network and can be broadly split into three periods: introductory, growth, and (for Right and Left Trolls) amplification. During the introductory period, trolls produced “original” content and replied to other accounts, developing their character and placing themselves in the network. As the network matured, they transitioned into engaging in a mix of “original” content and external retweets, with internal (fellow troll) networked activity and external (non-troll) replies declining. Throughout this period troll follower counts grew consistently. The Right Trolls and Hashtag Gamers also shifted to retweeting smaller accounts as their networks matured. Finally, on October 6th, both Right and Left Trolls shifted to an amplification period, retweeting outside accounts at very high rates, an activity in which they persist until, at least, the beginning of May 2017. For Left Troll accounts, the spike in activity on October 6th was particularly large, the biggest single day of output over the entire campaign. 1Linvill and Warren (2020) provide some evidence that October 6th was selected to activate left-wing actors who were already suspicious of Clinton’s candidacy in anticipation of the release of John Podesta’s emails, but the exact timing is not particularly important to the overall strategy we document in this paper.
Our findings suggest that an amplification strategy was pursued in order to raise the activity level and prominence of organic accounts that would naturally act (and react) in ways that aligned with the trolls’ purposes. From October 2016 through May 2017 (when many accounts were shut down), more than 100k different accounts outside the network were amplified in this way. Relative to randomly selected retweeted political accounts, the IRA linked to smaller accounts that were less likely to be verified, suggesting they targeted less prominent accounts, perhaps with the goal of increasing their prominence.
Our findings suggest several implications, both for how we understand disinformation campaigns and how we respond to them. First, the amplification period as the apparent culmination of the network’s life indicates the importance real users’ voices play in disinformation. Just before and after the 2016 Presidential election, the IRA largely focused not on their own words, but, through networked output, on the messaging of real users. When they put their carefully crafted tools to what was presumably their final purpose, it was not to make themselves more prominent but rather others. It is probable this was, at least in part, an effort to raise the prominence of accounts already actively engaged in communicating messages in line with IRA goals.
Second, our findings suggest ways in which coordinated activity can be identified and removed from platforms. Genuine users, presumably, rarely conduct their social media activity in the regimented and procedural manner demonstrated here. Identifying patterns in how disinformation accounts are introduced, grown, and ultimately purposed may help in combatting the problem. Future research should explore the potential for methods such as machine learning to examine such patterns among accounts to identify coordinated disinformation.
Finally, our research points to needed changes in how we engage online in the face of coordinated disinformation. Real users are not only the targets of disinformation, they are the tools of it as well. This supports Linvill’s (2019) assertion that media literacy interventions cannot simply focus on the product of media, but the process through which users receive and consume media. We need to teach users to examine not just the content of media they receive, but the sender as well. It is important to understand that their online engagements may have broader implications that unknowingly support the aims of coordinated campaigns.
Findings
Finding 1: Three sets of IRA thematic accounts (Right Trolls, Left Trolls, and Hashtag Gamers) made extensive use of networked output, throughout the campaign, both internally and externally.
IRA accounts were thematic (Linvill & Warren, 2020), and the accounts that interacted most with outsiders fell into one of three themes: Right Troll, Left Troll, and Hashtag Gamers. The first panel of Figure 4 presents the most prominent words in account descriptions from trolls of these three types. Figure 1 illustrates the number of times troll accounts replied to and retweeted other accounts of the indicated type, in each week, throughout 2015-2018. Panel A. illustrates the use of replies within the network. Panel B illustrates the use of retweets within the network. These first two panels illustrate how these networked outputs were used internally, where the titles above each timeline indicate the type of troll that produced the content that was retweeted/replied to, and the colors of the lines indicate the type of troll doing the retweeting/replying. Blue indicates tweets by Left Trolls, red for Right Trolls, and green for Hashtag Gamers. Note that the scales of these graphs vary widely.
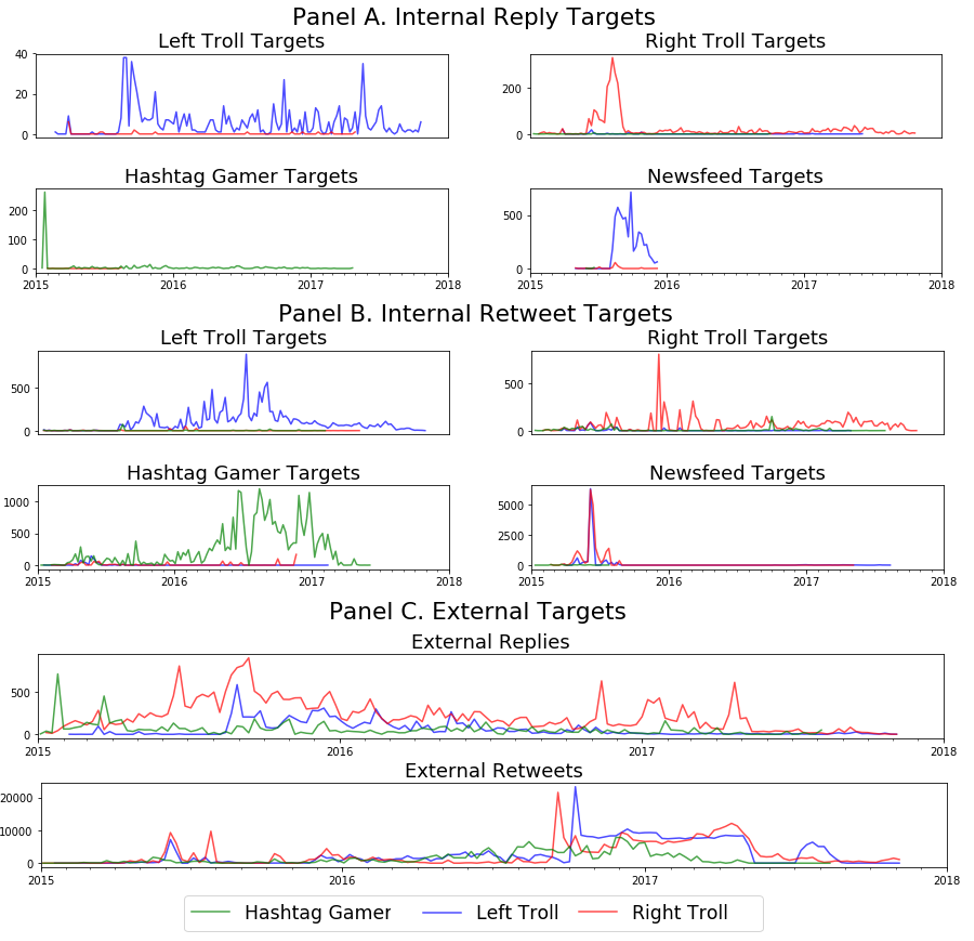
The timelines in panel C indicate the patterns of networked activity directed at accounts outside the IRA network. These externally directed outputs make up most of the networked activity.
Finding 2: Replies were used primarily early in the life of the troll accounts and early in the campaign.
Panels A and C of Figure 1 shows that replying was concentrated in the early part of the 2015–2017 campaign. This was true for all three troll types that originated networked output, and for all four troll types that were targeted by networked output. It was also true for externally targeted replies.
Figure 2 presents the trolls’ externally networked activity as shares of overall activity within each week of the sample. Each panel represents the networked output of trolls of the indicated type, with external retweet shares in blue and external reply shares in orange.
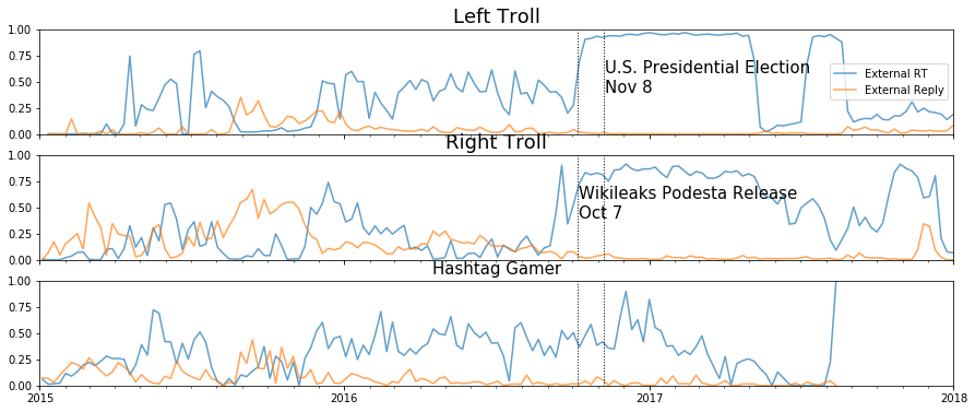
The most prominent use of external replies occurs in the in the Fall of 2015, when all three types devote their highest percentage of output to that activity. The Right Trolls engage in a second period of similar activity in the summer of 2016, which may seem at odds with the hypothesis of introduction. In fact, this second introductory spell for the Right Trolls is consistent with a new set of Right Troll accounts who first appear in the beginning of 2016 (see Appendix Figure 1). The other troll types had a single account creation spike at the beginning 2015 and, therefore, a single introductory period. This pattern is evidence that the introductory period was a function of the life cycle of the network, rather than simply a change in behavior over calendar time. 2A more direct demonstration of the extensive use of external replies early in troll accounts’ lives is presented in Appendix Figure 2, which shows the fraction of accounts using external replies as a function of the accounts’ tweet count. Over the first 1000 tweets of a Left or Right Troll’s life, external replies decline from about 15 percent of the average account’s output to less than 5 percent. Outside these spells, there is very little use of external replies.
Finding 3: After this introductory period, the mix shifts to approximately half original content and half external retweets. During this “growth” period, troll accounts substantially increase followers.
From the end of the introductory period through August, 2016, the trolls engaged in what we term the “growth period.” In this period, external retweet activity is moderate, while external reply activity declines. Left Trolls and Hashtag Gamers also engaged in significant internal retweeting, but no types did significant internal replying (Figure 1).
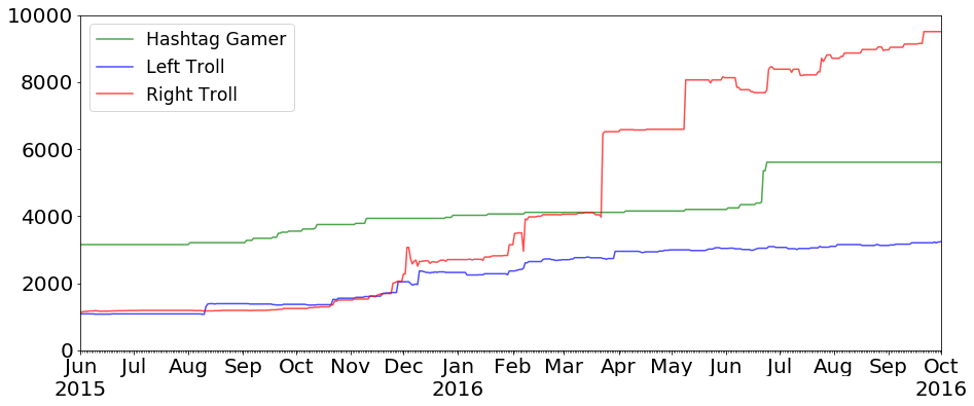
The average estimated follower counts of trolls of each type increased throughout this period. Figure 3 illustrates the approximate mean follower counts for active trolls of each troll type from the middle of 2015 through October 2016. 3We present mean follower counts for accounts or which we had a more complete follower record in Appendix Figure 3, which looks nearly identical We present median follower counts in Appendix Figure 4, which show flatter trajectories, especially for Left Trolls.
Finding 4: In Sep–Oct, 2016, the mix for Left and Right Trolls shifts again to over 90 percent external retweets.
Right and Left Trolls transition into the third regime, what we call the “amplification period”, in mid-September (for the Right Trolls) and early October (for the Left Trolls) of 2016. In this final period, activity spikes dramatically, accompanied by an upward shift in external retweets (see Figure 1, panel C). Beginning on October 6, 2016, both Right and Left Trolls changed their behavior along multiple dimensions, including tweeting at much higher rates, more consistent tweet production, and almost exclusively retweeting outside the network. This change continued until May 2017, when many accounts stopped tweeting.
Hashtag Gamers, in contrast, make no transition from growth to amplification. Rather, they decrease their output and external share throughout 2017, stopping in July.
Finding 5: External accounts targeted in this way were thematically aligned with the troll accounts.
Internal networked activity was very homophilic. Figure 1 illustrates that the internal networked activity targeting Right Trolls, Left Trolls, and Hashtag Gamers originated overwhelmingly from other accounts of the same type. News Feeds originated no retweets or replies but were retweeted by the Right and Left Trolls in large numbers in mid-2015.
Consistent with findings from Freelon and Lokot (2020), we found evidence of homophilic networked activity with external retweets and replies, as well. Figure 4 presents word clouds of the account descriptions associated with several sets of accounts. The first panel presents an output-weighted word cloud of the most common words included in the final account description of the actual IRA trolls of the indicated types, where the size of the word indicates its prominence. The second panel presents similar word clouds for the accounts that were replied to by trolls of the indicated types, where the account descriptions were gathered in January 2019. The third panel presents the descriptions of external accounts retweeted by the trolls. There is significant overlap in these sets.
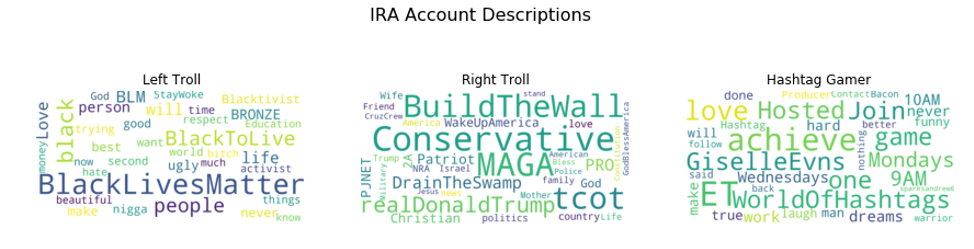
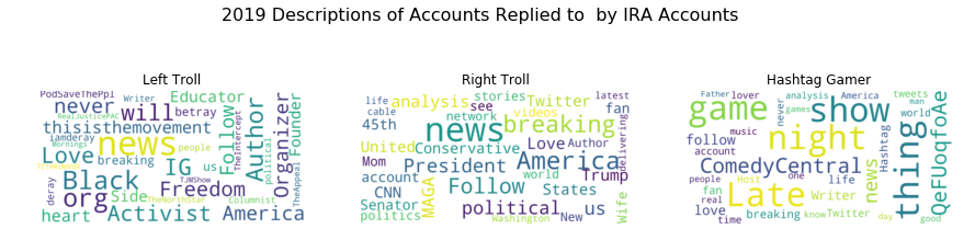
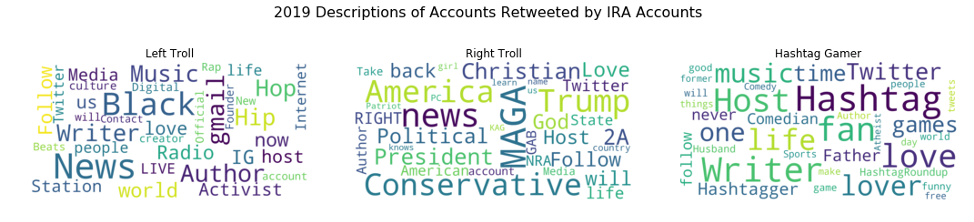
But there are some consistently prominent words in the descriptions of retweeted accounts that are not prominent in the original troll accounts. These include several terms that indicate that the account is a member of the media, including words like “News,” “Author,” “Host,” and “Radio.”
Finding 6: External accounts targeted in this way were smaller and less prominent than is normal for accounts that are retweeted/replied to political discourse in this era.
The trolls retweeted and replied to much smaller accounts than is usual in political oriented Twitter. Table 1 displays the distribution of January 2019 follower counts among accounts retweeted and replied to by the trolls. The accounts retweeted and replied to by trolls have fewer followers than those retweeted by random political accounts (see methodology, below, for definition). The difference is larger for replies, but that difference is mostly driven by the fact that random accounts reply to bigger accounts than they retweet, on average, while the trolls show only small and inconsistent differences. We also see differences between the fraction of targeted accounts that are verified, with all troll types retweeting and replying to a smaller share of verified accounts relative to random political accounts.
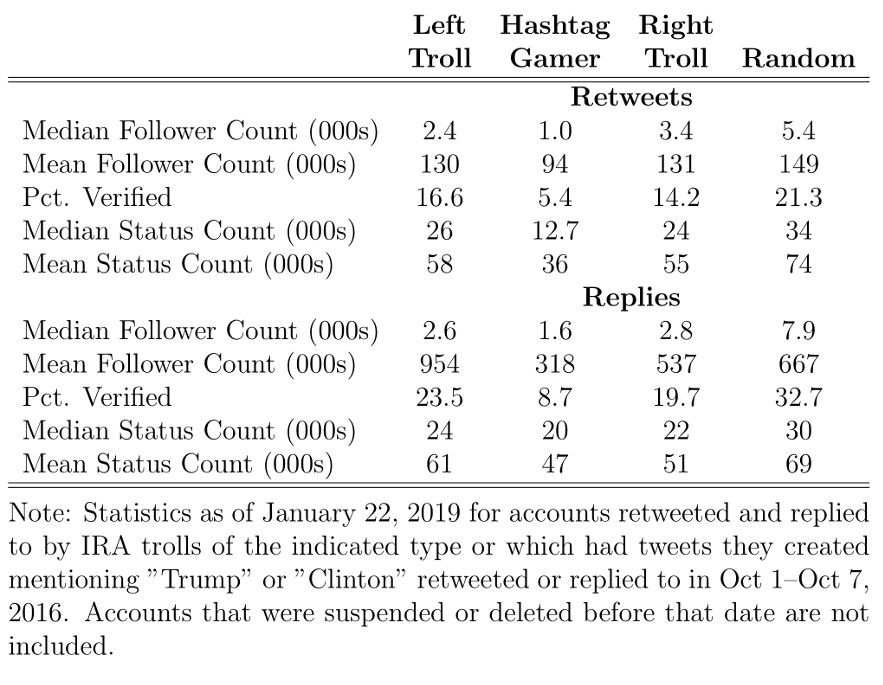
Finally, we can measure the activity of the external accounts by looking at the number of tweets those accounts have produced. For retweets, these results are broadly consistent with the other factors, the trolls retweet and reply to less active accounts than random political accounts do.
Methods
We conduct a case study of the strategy behind the use of networked output of the Internet Research Agency on Twitter during the 2015–2017 English-language campaign.
We use data from four sources. First, the output of the IRA-affiliated accounts and the identities of the accounts they retweet and reply to come from the hashed version of Twitter’s January 2019 update to their October 2018 release of the output they linked to the IRA (Roth, 2019). Second, we use Linvill & Warren’s (2020) categorization of these accounts into thematic type. 4The Linvill–Warren categories are available at https://github.com/patrick-lee-warren/IRA-Troll-Types.
From these data, we create metrics of internal and external activity over time, including: 1) raw counts of retweets and replies, as a function of the category of originating account and (for internal targets) the category of the targeted accounts; 2) the fraction of output devoted to the various sorts of networked output. As only three troll types (Left Troll, Right Trolls, and Hashtag Gamers) engage in substantial networked output, we limit our attention output by those types. Newsfeeds targeted by substantial networked output but produce none, while Fearmongers neither originate nor are targeted with substantial networked output from within the network.
These analyses are appropriate to answer the first research question because the timing of behavior can be an important signal of the purpose these activities play in the overall strategy of the campaign, especially when taken in concert with the extensive facts we already know about this campaign.
The third dataset comes from a search of the IRA Twitter output on Social Studio, a social media analytics platform that collects a nearly complete, nearly real-time record of Twitter output (Salesforce, 2020). From it, we observe follower counts of the IRA accounts over time. These data are available for nearly every troll account, from the moment each tweet is gathered, usually immediately after the tweet is posted. Between June 2015 and October 2016, we can make this match for over 70% of tweets appearing in the Twitter database, with the match rate improving over time, up to 80% in 2016. The imperfect match arises from a combination of Social Studio’s incomplete scraping and our imperfect ability to match accounts that changed screen names over time.
The irregular collection of follower data introduces two complications. First, we do not observe follower counts for days during which no tweets from the account are produced/scraped. Rather than statistically impute growth rates over the days between tweets we instead hold follower counts fixed at the last observed level. This procedure means that we likely understate follower counts for days where the accounts produce no tweets. That said, these accounts were quite active. We observe follower counts, on average, for about 22 percent of days. We observed them more frequently than that for the most active trolls. Dropping accounts for which the maximum projection is large (say, above 60 days), has no substantial effect on the results (see Appendix Figure 3).
A second, related, complication is that we do not observe the first or last date on which the account was operational. 5We do have account creation dates, but these are unreliable, as many of these accounts sat idle for many years before they began participating in this operation. First tweet is a better measure. Instead, we observe the first and last date on which the account produced a tweet. Thus, when calculating follower rates for troll accounts, we consider an account as “active” for days between its first and last tweet. As accounts were introduced and (apparently) shut down throughout 2016, the mix of accounts can change substantially over the growth period (see Appendix Figure 1).
We also use Social Studio to collect all tweets including “Trump” or “Clinton” during Oct 1–7, 2016, to identify a sample of 2 million non-IRA tweets from accounts tweeting about politics in that period. From these, we randomly select 200k retweets, and collect the identity of the accounts that originated those retweeted tweets. We refer to those accounts as the “Random Retweet” sample of politically active accounts. We perform a similar exercise for accounts that were replied to in that set of 2 million tweets.
Finally, we extract account characteristics and descriptions for all external accounts, both those connected to the Trolls and the Random sample, from the Twitter User Look-Up API, as of January 2019. These characteristics include follower, following, and update counts; account description; and whether the account is verified. These are the statistics presented in Table 1 and the account descriptions are summarized in the word clouds in the bottom two panels of Figure 4.
These features are available for any account that still exists and is not suspended as of January 22, 2019. Eighty-seven percent of the accounts retweeted by the Trolls were still present on Twitter by that date. We cannot exactly calculate the fraction of those accounts randomly retweeted on Oct 1–7, 2016 that appear in the Random Retweet sample, as we can only observe the account id for statuses that were still active in 2019.
The addition of these final two datasets allows us to answer the second research question, by calculating the characteristics of the accounts targeted by the external activities of the IRA and contrasting those characteristics with those of the control accounts that were targeted in the same way by accounts outside the IRA network. The comparison to “normal” behavior is particularly important and appropriate, as deviations from organic usage are particularly indicative of strategic behavior.
Finally, this study has several important limitations to note. First, it is a study on one specific information operation and, as such, has applicability beyond this case only to the extent that others adopt similar strategies. Second, the findings are reliant on data supplied by Twitter who were understandably circumspect in sharing how they identified accounts associated with the IRA. It is possible the accounts we analyzed were only a portion of the total population and that our findings are biased in unknown ways. Third, our data on follower counts is incomplete, requiring some projection of follower counts for dates where they are not observed. Similarly, our data on the characteristics of the accounts retweeted by the trolls and the random sample that were active in October 2016 is limited to those accounts that still existed in January 2019, which may inject some selection biases. None-the-less, the data analyzed is the most complete available for understanding IRA activity and can certainly give us a window into their work, if not the complete picture.
Topics
Bibliography
Badaway, A., Lerman, K., and Ferrara, E. (2018). “Who falls for online political manipulation? the case of the Russian interference campaign in the 2016 U.S. presidential election.” In IEEE/ACM International Conference on Advances in Social Networks Analysis and Mining.
Bail, C., et al. (2020) “Assessing the Russian Internet Research Agency’s impact on the political attitudes and behaviors of American Twitter users in late 2017” Proceedings of the National Academy of Sciences of the United States, 117 (1) 243-250.
Freelon, D., and Tetyana L. (2020) “Russian disinformation campaigns on Twitter target political communities across the spectrum. Collaboration between opposed political groups might be the most effective way to counter it.” Misinformation Review 1, no. 1.
Linvill, D. L. (2019). “Addressing social media dangers within and beyond the college campus.” Communication Education, 68, 371-380.
Linvill, D. L., Boatwright, B., Grant, W., and Warren, P. L. (2019). “‘The Russians are hacking my brain!’ investigating Russia’s Internet Research Agency Twitter tactics during the 2016 United States presidential campaign.” Computers in Human Behavior, 99:292–300.
Linvill D. L. and Warren, P. L. (2020) “Troll Factories: Manufacturing Specialized Disinformation on Twitter”, Political Communication, doi:10.1080/10584609.2020.1718257
Roth, Y. (2019). Enabling further research of potential information operations on Twitter. Technical report, Twitter. https://blog.twitter.com/en_us/topics/company/2019/further_research_information_operations.html
Salesforce (2020). Marketing Cloud—Social Studio https://www.salesforce.com/products/marketing-cloud/social-media-marketing/
Starbird, K., Arif, A., and Wilson, T. (2019). “Disinformation as Collaborative Work: Surfacing the Participatory Nature of Strategic Information Operation.” PACMHCI. 3, Computer-Supported Cooperative Work (CSCW 2019).
Stewart, L. G., Arif, A., and Starbird, K. (2018). “Examining trolls and polarization with a retweet network.” In MIS2, 2018, Marina Del Rey, CA, USA, 1–6.
Funding
The research was supported by a grant from the Charles G. Koch Foundation.
Competing Interests
No conflicts to report from either author.
Ethics
Institutional review for this project was unnecessary as it analyzes only public social media posts and those reproduced in public data archives.
Copyright
This is an open access article distributed under the terms of the Creative Commons Attribution License, which permits unrestricted use, distribution, and reproduction in any medium, provided that the original author and source are properly credited.
Data Availability
https://dataverse.harvard.edu/dataset.xhtml?persistentId=doi:10.7910/DVN/DI2GD1