Peer Reviewed
Right and left, partisanship predicts (asymmetric) vulnerability to misinformation
Article Metrics
46
CrossRef Citations
PDF Downloads
Page Views
We analyze the relationship between partisanship, echo chambers, and vulnerability to online misinformation by studying news sharing behavior on Twitter. While our results confirm prior findings that online misinformation sharing is strongly correlated with right-leaning partisanship, we also uncover a similar, though weaker, trend among left-leaning users. Because of the correlation between a user’s partisanship and their position within a partisan echo chamber, these types of influence are confounded. To disentangle their effects, we performed a regression analysis and found that vulnerability to misinformation is most strongly influenced by partisanship for both left- and right-leaning users.
Research Questions
- Is exposure to more partisan news associated with increased vulnerability to misinformation?
- Are conservatives more vulnerable to misinformation than liberals?
- Are users in a structural echo chamber (highly clustered community within the online information diffusion network) more likely to share misinformation?
- Are users in a content echo chamber (where social connections share similar news) more likely to share misinformation?
Essay Summary
- We investigated the relationship between political partisanship, echo chambers, and vulnerability to misinformation by analyzing news articles shared by more than 15,000 Twitter accounts in June 2017.
- We quantified political partisanship based on the political valence of the news sources shared by each user.
- We quantified the extent to which a user is in an echo chamber by two different methods: (1) the similarity of the content they shared to that of their friends, and (2) the level of clustering of users in their follower network.
- We quantified the vulnerability to misinformation based on the fraction of links a user shares from sites known to produce low-quality content.
- Our findings suggest that political partisanship, echo chambers, and vulnerability to misinformation are correlated. The effects of echo chambers and political partisanship on vulnerability to misinformation are confounded, but a stronger link can be established between partisanship and misinformation.
- The findings suggest that social media platforms can combat the spread of misinformation by prioritizing more diverse, less polarized content.
Implications
Two years since the call for a systematic “science of fake news” to study the vulnerabilities of individuals, institutions, and society to manipulation by malicious actors (Lazer et al., 2018), the response of the research community has been robust. However, the answers provided by the growing body of studies on (accidental) misinformation and (intentional) disinformation are not simple. They paint a picture in which a complex system of factors interact to give rise to the patterns of spread, exposure, and impact that we observe in the information ecosystem.
Indeed, our findings reveal a correlation between political partisanship, echo chambers, and vulnerability to misinformation. While this confounds the effects of echo chambers and political partisanship on vulnerability to misinformation, the present analysis shows that partisanship is more strongly associated with misinformation. This finding suggests that one approach for social media platforms to combat the spread of misinformation is by prioritizing more diverse, less polarized content. Methods similar to those used here can be readily applied to the identification of such content.
Prior research has highlighted an association between conservative political leaning and misinformation sharing (Grinberg et al., 2019) and exposure (Chen et al., 2020). The proliferation of conspiratorial narratives about COVID-19 (Kearney et al., 2020; Evanega et al., 2020) and voter fraud (Benkler et al., 2020) in the run-up to the 2020 U.S. election is consistent with this association. As social media platforms have moved to more aggressively moderate disinformation around the election, they have come under heavy accusations of political censorship. While we find that liberal partisans are also vulnerable to misinformation, this is not a symmetric relationship: Consistent with previous studies, we also find that the association between partisanship and misinformation is stronger among conservative users. This implies that attempts by platforms to be politically “balanced” in their countermeasures are based on a false equivalence and therefore biased—at least at the current time. Government regulation could play a role in setting guidelines for the non-partisan moderation of political disinformation.
Further work is necessary to understand the nature of the relationship between partisanship and vulnerability to misinformation. Are the two mutually reinforcing, or does one stem from the other? The answer to this question can inform how social media platforms prioritize interventions such as fact-checking of articles, reining in extremist groups spreading misinformation, and changing their algorithms to provide exposure to more diverse content on news feeds.
The growing literature on misinformation identifies different classes of actors (information producers, consumers, and intermediaries) involved in its spread, with different goals, incentives, capabilities, and biases (Ruths, 2019). Not only are individuals and organizations hard to model, but even if we could explain individual actions, we would not be able to easily predict collective behaviors, such as the impact of a disinformation campaign, due to the large, complex, and dynamic networks of interactions enabled by social media.
Despite the difficulties in modeling the spread of misinformation, several key findings have emerged. Regarding exposure, when one considers news articles that have been fact-checked, false reports spread more virally than real news (Vosoughi et al., 2018). Despite this, a relatively small portion of voters was exposed to misinformation during the 2016 U.S. presidential election (Grinberg et al., 2019). This conclusion was based on the assumption that all posts by friends are equally likely to be seen. However, since social media platforms rank content based on popularity and personalization (Nikolov et al., 2019), highly-engaging false news would get higher exposure. In fact, algorithmic bias may amplify exposure to low-quality content (Ciampaglia et al., 2018).
Other vulnerabilities to misinformation stem from cognitive biases such as lack of reasoning (Pennycook & Rand, 2019a) and preference for novel content (Vosoughi et al., 2018). Competition for our finite attention also has been shown to play a key role in content virality (Weng et al., 2012). Models suggest that even if social media users prefer to share high-quality content, the system-level correlation between quality and popularity is low when users are unable to process much of the information shared by their friends (Qiu et al., 2017).
Misinformation spread can also be the result of manipulation. Social bots (Ferrara et al., 2016; Varol et al., 2017) can be designed to target vulnerable communities (Shao et al., 2018b; Yan et al., 2020) and exploit human and algorithmic biases that favor engaging content (Ciampaglia et al., 2018; Avram et al., 2020), leading to an amplification of exposure (Shao et al., 2018a; Lou et al., 2019).
Finally, the polarized and segregated structure of political communication in online social networks (Conover et al., 2011) implies that information spreads efficiently within echo-chambers but not across them (Conover et al., 2012). Users are thus shielded by diverse perspectives, including fact-checking sources (Shao et al., 2018b). Models suggest that homogeneity and polarization are important factors in the spread of misinformation (Del Vicario et al., 2016).
Findings
Finding 1: Users are segregated based on partisanship.
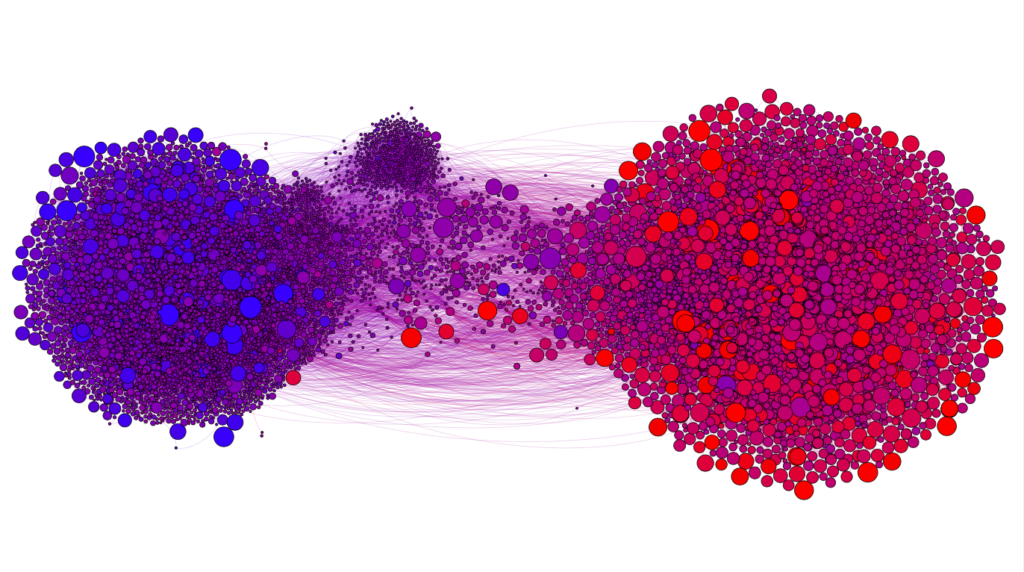
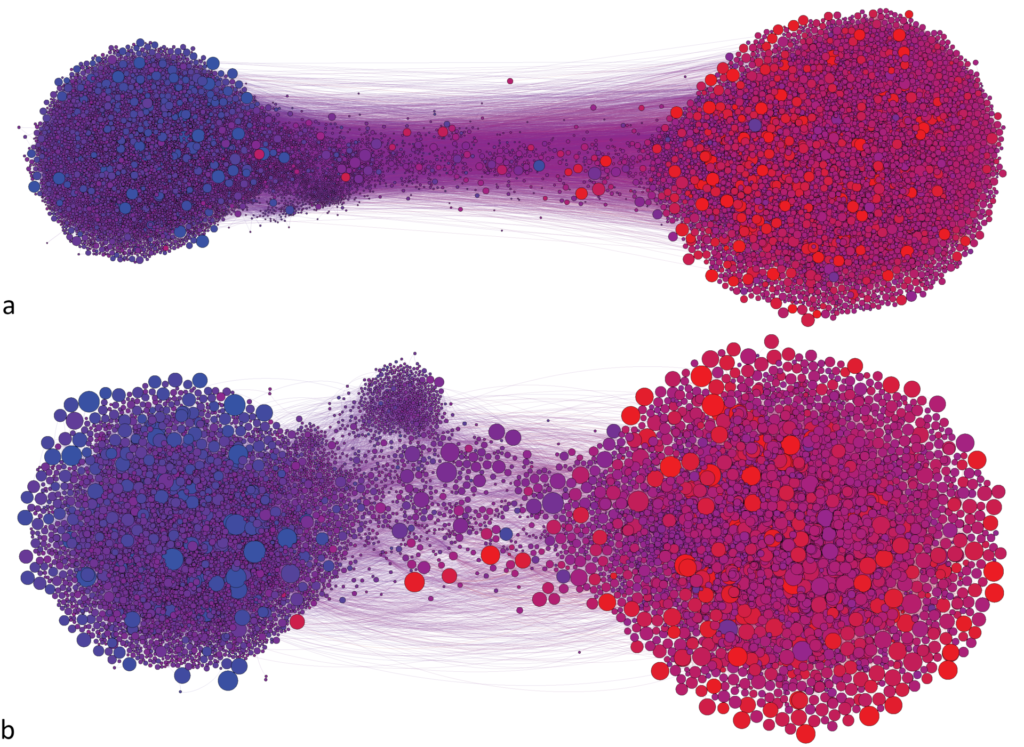
Let us first reproduce findings about the echo-chamber structure of political friend/follower and diffusion networks on Twitter (Conover et al., 2011; 2012) using our dataset. Figure 1 visualizes both networks, showing clear segregation into two dense partisan clusters. Conservative users tend to follow, retweet, and quote other conservatives; the same is true for liberal users.
Finding 2: Vulnerability to misinformation, partisanship, and echo chambers are related phenomena.
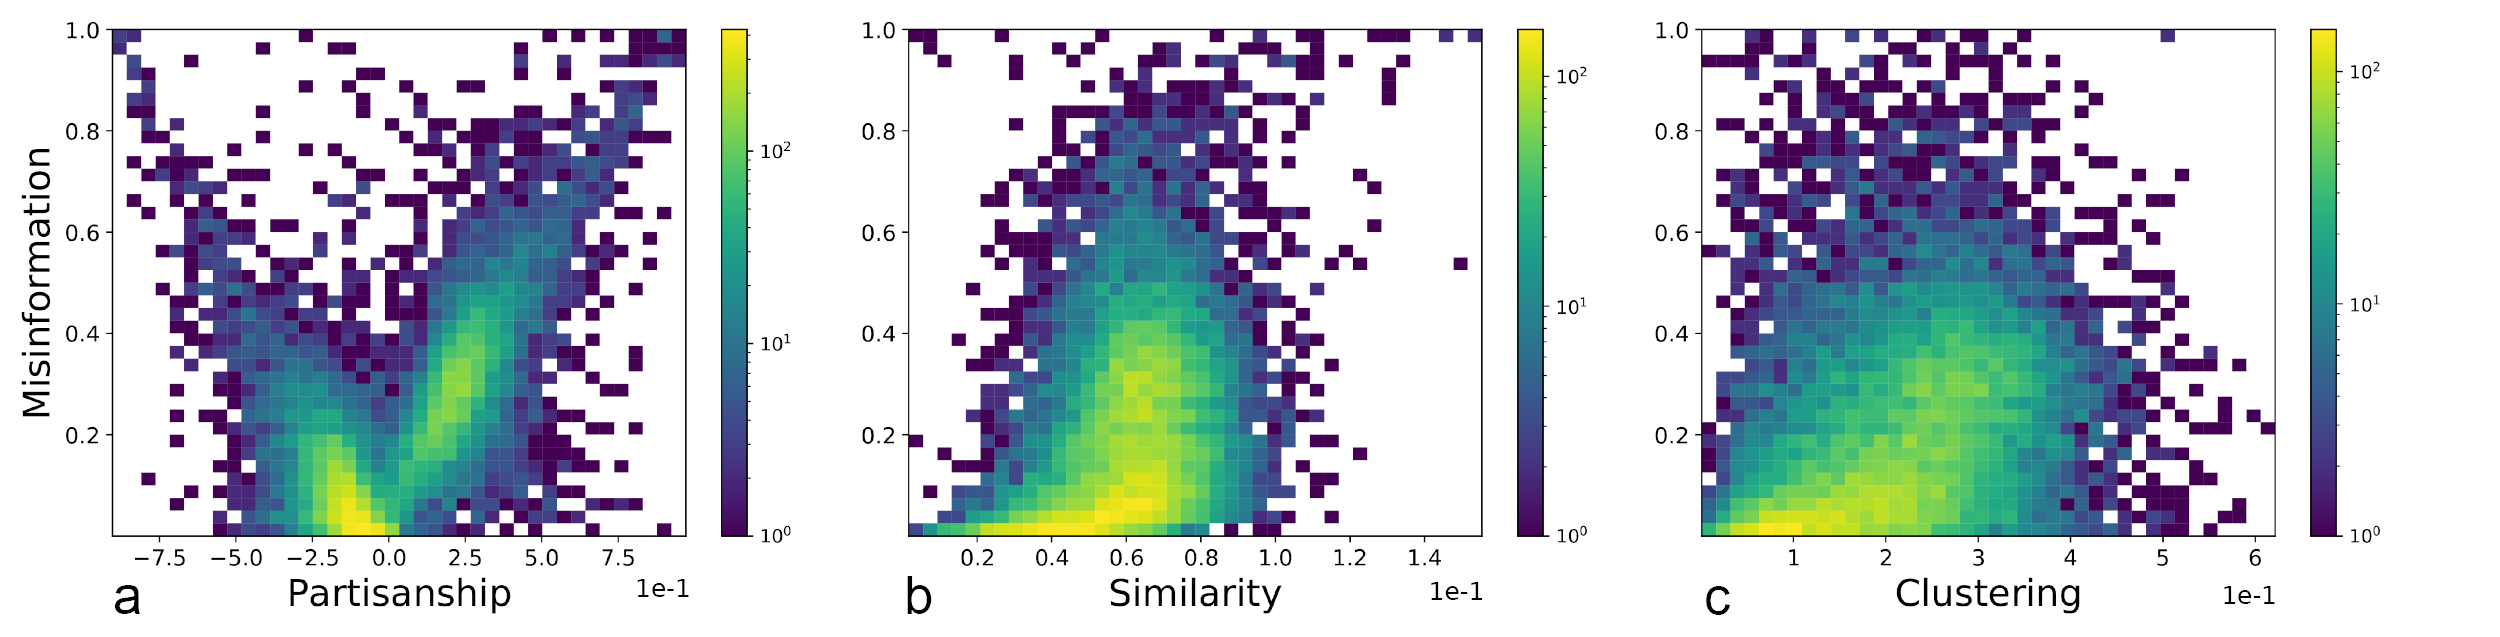
We want to test the hypothesis that partisanship, echo chambers, and the vulnerability to misinformation are related phenomena. We define a Twitter user’s vulnerability to misinformation by the fraction of their shared links that are from a list of low-quality sources. Consistent with past research (Grinberg et al., 2019), we observe that vulnerability to misinformation is strongly correlated with partisanship in right-leaning users. However, unlike past work, we find a similar effect for left-leaning users (Figure 2a). Overall, we observe that right-leaning users are slightly more likely to be partisan and to be vulnerable to misinformation. The great majority of users on both sides of the political spectrum have misinformation scores below 0.5, indicating that those who share misinformation also share a lot of other types of content. In addition, we observe a moderate relationship between vulnerability to misinformation and two measures that capture the extent to which a user is in an echo chamber: the similarity among sources of links shared by the user and their friends (Figure 2b) and the clustering in the user’s follower network (Figure 2c).
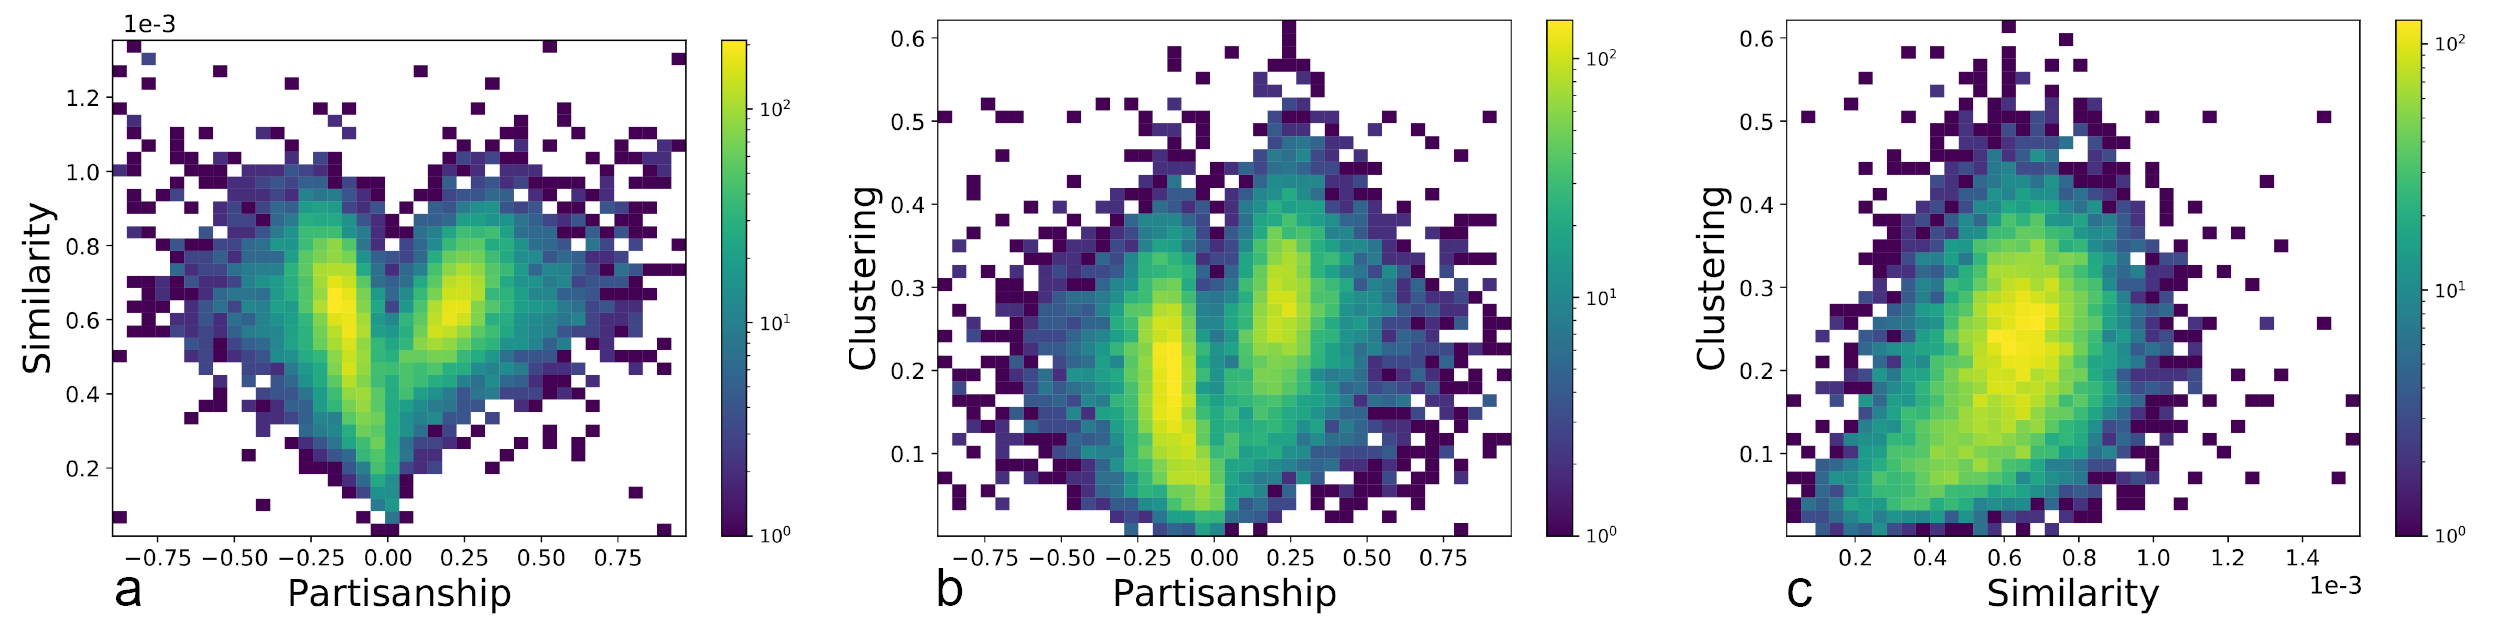
In Figure 3 we show that the three independent variables we analyze (partisanship, similarity, and clustering) are actually correlated with each other. User similarity and clustering are moderately correlated, as we might expect given that they both aim to capture the notion of embeddedness within an online echo chamber. Partisanship is moderately correlated to both echo chamber quantities.
Finding 3: Vulnerability to misinformation is most strongly influenced by partisanship.
Given these correlations, we wish to disentangle the effect of partisanship and echo chambers on vulnerability to misinformation. To this end, we conducted a regression analysis using vulnerability to misinformation as the dependent variable. The results are summarized in Table 1. We see that all independent variables except clustering for left-leaning users significantly affect the dependent variable (p < 0.01). However, as shown by the coefficients and the adjusted increases in R2, the effect is much stronger for partisanship.

Identifying the most vulnerable populations may help gauge the impact of misinformation on election outcomes. Grinberg et al. (2019) identified older individuals and conservatives as particularly likely to engage with fake news content, compared with both centrists and left-leaning users. These characteristics correlate with those of voters who decided the presidential election in 2016 (Pew Research Center, 2018), leaving open the possibility that misinformation may have affected the election results.
Our analysis of the correlation between misinformation sharing, political partisanship, and echo chambers paints a more nuanced picture. While right-leaning users are indeed the most likely to share misinformation, left-leaning users are also significantly more vulnerable than moderates. In comparing these findings, one must keep in mind that the populations are different—voters in the study by Grinberg et al. (2019) versus Twitter users in the present analysis. Causal links between political bias, motivated reasoning, exposure, sharing, and voting are yet to be fully explored. To confirm that partisanship is associated with vulnerability to misinformation for both left- and right-leaning users, we conducted regression analysis comparing partisan (liberal or conservative) against moderate users. To this end, we grouped all users together and took the absolute value of their partisanship score as an independent variable. The results from this analysis (Table 2) show that partisan users are more vulnerable than moderate users, irrespective of their political leanings.

Methods
Dataset
We collected all tweets containing links (URLs) from a 10% random sample of public posts between June 1 and June 30, 2017, through the Twitter API. This period was characterized by intense political polarization and misinformation around the world and especially in the U.S. (Boxell at al., 2020). Major news events included the announcement of the U.S. withdrawal from the Paris Agreement; reinstatement of the ban on immigration ban from Muslim- majority countries; emerging details from the Muller investigation about Russian interference in the 2016 U.S. election; American and Russian interventions in Syria; James Comey’s Senate Intelligence Committee testimony; the Congressional baseball shooting; U.S. restrictions on travel and business with Cuba; a special congressional election in Georgia; and continuing efforts to repeal Obamacare.
Since we are interested in studying the population of active online news consumers, we selected all accounts that shared at least ten links from a set of news sources with known political valence (Bakshy et al., 2015; see “Partisanship” section below) during that period. To focus on users who are vulnerable to misinformation, we further selected those who shared at least one link from a source labeled as low-quality. This second condition excludes 5% of active right-leaning users and 30% of active left-leaning users. Finally, to ensure that we are analyzing human users and not social bots, we used the BotometerLite classifier (Yang et al., 2020) to remove likely bot accounts. This resulted in the removal of a little less than 1% of the accounts in the network. The user selection process resulted in the dataset analyzed in this paper, whose statistics are summarized in Table 3.

Network analysis
We created two networks. First, we used the Twitter Friends API to build the follower network among the users in our dataset. Second, we considered the retweets and quotes in the dataset to construct a diffusion network. Both networks are very dense and, consistently with previous findings, have a deeply hierarchical core–periphery structure (Conover et al., 2012). Application of k-core decomposition (Alvarez-Hamelin et al., 2005) to the follower network reveals a core with k = 940, meaning that each user has at least 940 friends and/or followers among other accounts within the network core. Since the network includes more than 4 million edges, in Figure 1a we sample 10% (432,745) of these edges and then visualize the k = 2 core of the largest connected component. The retweet/quote network has a k = 21 core and includes 111,366 edges. In Figure 1b we visualize the k = 2 core of the largest connected component.
Partisanship
To define partisanship, we track the sharing of links from web domains (e.g., cnn.com) associated with news sources of known political valence. For a source of political valence, we use a dataset compiled by Facebook (Bakshy et al., 2015), which consists of 500 news organizations. By examining the Facebook page of each news organization, the political valence score was computed based on the political self-identification of the users who liked the page. The valence ranges from –1, indicating a left-leaning audience, to +1, indicating a right-leaning audience.
We define the partisanship of each user  as
as

where  is the fraction of links from source
  that shares, derived from the Twitter data, and
  is the political valence of source . In correlation and regression calculations, we take the absolute value
  for left-leaning users.
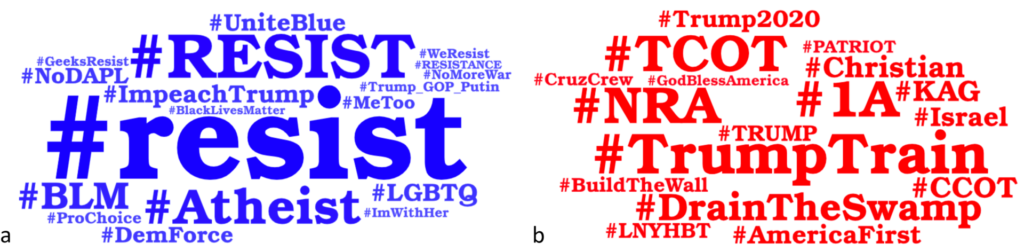
This definition of partisanship implicitly assumes that the sharing of a link implies approval of its content. While this is not necessarily true all of the time, we can reasonably assume it is true most of the time. To verify this, we sampled a subset of the accounts in our dataset (246 left- and 195 right-leaning users) and examined their profiles. Figure 4 visualizes the most common hashtags in the profile descriptions, confirming that our partisanship metric closely matches our intuitive understanding of left- and right-leaning users.
Misinformation
To define misinformation, we focus on the sources of shared links to circumvent the challenge of assessing the accuracy of individual news articles (Lazer et al., 2018). Annotating content credibility at the domain (website) level rather than the link level is an established approach in the literature (Shao et al., 2018b; Grinberg et al., 2019; Guess at al., 2019; Pennycook & Rand, 2019b; Bovet & Makse, 2019).
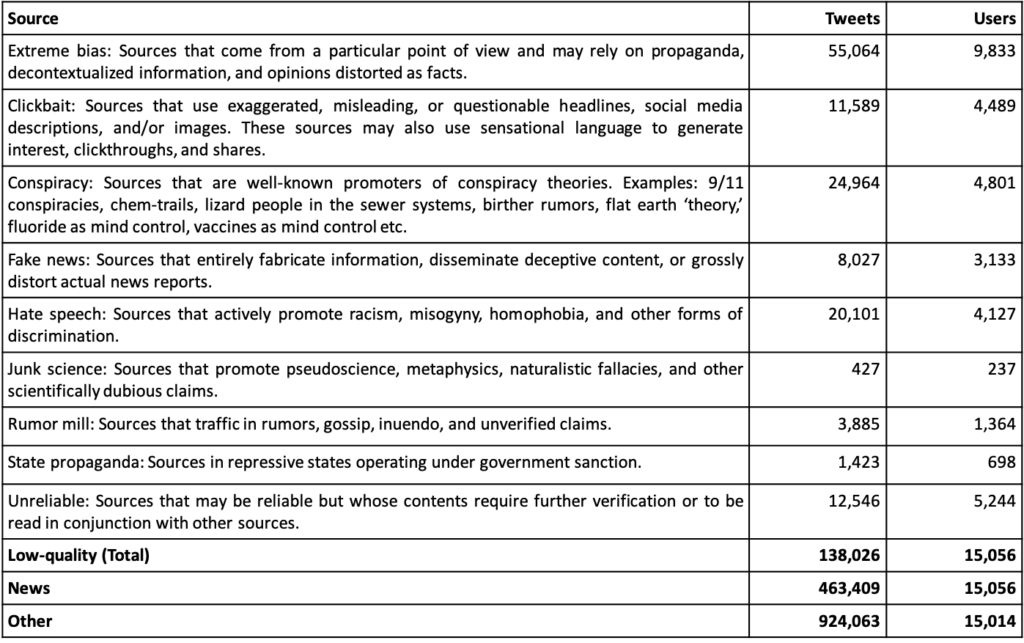
We considered a list of low-quality sources labeled by human judges (Zimdars et al., 2017; Zimdars, 2016). While the process employed for annotating sources is well-documented, the list is no longer maitained and its curation may be subject to the bias of the judges. Nevertheless, the list was current when our data was collected, and therefore has good coverage of low-credibility sources that were active at that time. More current lists of low-credibility domains do not allow for equal coverage because many sources have since become inactive. The annotation categories used to identify low-credibility sources in our dataset are shown in Table 4, along with statistics about their prevalence, as well as the numbers of links to news and other sources. Note that the total number of links shared is greater than the total number of tweets, for two reasons. First, a user can share multiple links in a single tweet; and second, most misinformation sources have multiple labels applied to them.
We extracted all links shared by each user, irrespective of whether they were from legitimate news, misinformation, or any other source. Each user’s misinformation score  is the fraction of all links they shared that were from sources labeled as misinformation.
User similarity
To measure similarity between users, we constructed the matrix of TF-IDF values for the user-domain matrix, with users analogous to documents (rows), and domains analogous to terms (columns). Thus, each user is represented by a vector of TF-IDF values indicating how strongly they are associated to each domain:

where is a user,  is a domain,
  is the frequency with which shares from , and

with  being the subset of users who have shared from domain , out of the set of users
  .
.
User clustering
To capture user clustering based on the follower network, we computed the clustering coefficient for each user as:

where  is the number of directed triangles through the user node ,
  is the sum of in-degree and out-degree for , and
  is the reciprocal degree of (Fagiolo, 2007). This measure quantifies how densely interconnected a user’s social network is. A dense follower network is another way to quantify an echo chamber.
Regression analysis
To compare the different factors that may contribute to a user’s misinformation score, we used multiple linear regression. Since the regression was performed for right- and left-leaning users separately, we took the absolute values of the partisanship scores. In addition, we took the z-score transform of each variable. The resulting regression equation is:

Topics
Bibliography
Alvarez-Hamelin, J. I., Dall’Asta, L., Barrat, A., & Vespignani, A. (2005). Large scale networks fingerprinting and visualization using the k-core decomposition. In Y. Weiss, B. Schölkopf, & J. Platt (Eds.), Advances in Neural Information Processing Systems (NIPS), 18, 41–50. https://dl.acm.org/doi/10.5555/2976248.2976254
Avram, M., Micallef, N., Patil, S., & Menczer, F. (2020). Exposure to social engagement metrics increases vulnerability to misinformation. Harvard Kennedy School (HKS) Misinformation Review, 1(5). https://misinforeview.hks.harvard.edu/article/exposure-to-social-engagement-metrics-increases-vulnerability-to-misinformation/
Bakshy, E., Messing, S., & Adamic, L. (2015). Exposure to ideologically diverse news and opinion on Facebook. Science, 348(6239), 1130–1132. https://doi.org/10.1126/science.aaa1160
Benkler, Y., Tilton, C., Etling, B., Roberts, H., Clark, J., Faris, R., Kaiser, J., & Schmitt, C. (2020, October 8). Mail-in voter fraud: Anatomy of a disinformation campaign. Berkman Center Research Publication No. 2020-6. https://doi.org/10.2139/ssrn.3703701
Bovet, A., & Makse, H. A. (2019). Influence of fake news in Twitter during the 2016 US presidential election. Nature Communications, 10 (7). https://doi.org/10.1038/s41467-018-07761-2
Boxell, L., Gentzkow, M., & Shapiro, J. (2020, January). Cross-country trends in affective polarization (NBER Working Paper No. 26669). National Bureau of Economic Research. https://www.nber.org/papers/w26669
Chen, W., Pacheco, D., Yang, K. C., & Menczer, F. (2020). Neutral bots reveal political bias on social media. ArXiv: 2005.08141 [cs.SI]. https://arxiv.org/abs/2005.08141
Ciampaglia, G., Nematzadeh, A., Menczer, F., & Flammini, A. (2018). How algorithmic popularity bias hinders or promotes quality. Scientific Reports, 8(1). https://doi.org/10.1038/s41598-018-34203-2
Conover, M., Ratkiewicz, J., Francisco, M., Gonçalves, B., Flammini, A., & Menczer, F. (2011). Political polarization on Twitter. Proceedings of the 5th International AAAI Conference on Weblogs and Social Media (ICWSM 2011), 89–96. https://www.aaai.org/ocs/index.php/ICWSM/ICWSM11/paper/viewFile/2847/3275
Conover, M., Gonçalves, B., Flammini, A., & Menczer, F. (2012). Partisan asymmetries in online political activity. EPJ Data Science, 1(1). https://doi.org/10.1140/epjds6
Del Vicario, M., Bessi, A., Zollo, F., Petroni, F., Scala, A., Caldarelli, G., Stanley, H., & Quattrociocchi, W. (2016). The spreading of misinformation online. Proceedings of the National Academy of Sciences, 113(3), 554–559. https://doi.org/10.1073/pnas.1517441113
Evanega, S., Lynas, M., Adams, J., Smolenyak, K., & Insights, C. G. (2020). Coronavirus misinformation: Quantifying sources and themes in the COVID-19 ‘infodemic’. Cornell Alliance for Science. https://allianceforscience.cornell.edu/wp-content/uploads/2020/10/Evanega-et-al-Coronavirus-misinformation-submitted_07_23_20-1.pdf
Fagiolo, G. (2007). Clustering in complex directed networks. Physical Review E, 76(2). https://doi.org/10.1103/physreve.76.026107
Ferrara, E., Varol, O., Davis, C., Menczer, F., & Flammini, A. (2016). The rise of social bots. Communications of the ACM, 59(7), 96–104. https://doi.org/10.1145/2818717
Grinberg, N., Joseph, K., Friedland, L., Swire-Thompson, B., & Lazer, D. (2019). Fake news on Twitter during the 2016 U.S. presidential election. Science, 363(6425), 374–378. https://doi.org/10.1126/science.aau2706
Guess, A., Nagler, J., & Tucker, J. (2019). Less than you think: Prevalence and predictors of fake news dissemination on Facebook. Science Advances, 5(1). https://doi.org/10.1126/sciadv.aau4586
Kearney, M., Chiang, S., & Massey, P. (2020). The Twitter origins and evolution of the COVID-19 “plandemic” conspiracy theory. Harvard Kennedy School (HKS) Misinformation Review 1(3). https://doi.org/10.37016/mr-2020-42
Lazer, D., Baum, M., Benkler, Y., Berinsky, A., Greenhill, K., Menczer, F., Metzger, M., Nyhan, B., Pennycook, G., Rothschild, D., Schudson, M., Sloman, S., Sunstein, C., Thorson, E., Watts, D., & Zittrain, J. (2018). The science of fake news. Science, 359(6380), 1094–1096. https://doi.org/10.1126/science.aao2998
Lou, X., Flammini, A., & Menczer, F. (2019). Manipulating the online marketplace of ideas. ArXiv:1907.06130 [cs.CY]. https://arxiv.org/abs/1907.06130
Nikolov, D., Lalmas, M., Flammini, A., & Menczer, F. (2019). Quantifying biases in online information exposure. Journal of the Association for Information Science and Technology, 70(3), 218–229. https://doi.org/10.1002/asi.24121
Pennycook, G., & Rand, D. G. (2019a). Lazy, not biased: Susceptibility to partisan fake news is better explained by lack of reasoning than by motivated reasoning. Cognition, 188, 39–50. https://doi.org/10.1016/j.cognition.2018.06.011
Pennycook, G., & Rand, D. G. (2019b). Fighting misinformation on social media using crowdsourced judgments of news source quality. Proceedings of the National Academy of Sciences, 116(7), 2521–2526. https://doi.org/10.1073/pnas.1806781116
Pew Research Center (2018, August 9). An examination of the 2016 electorate, based on validated voters. https://www.pewresearch.org/politics/2018/08/09/an-examination-of-the-2016-electorate-based-on-validated-voters/
Qiu, X., Oliveira, D. F. M., Sahami Shirazi, A., Flammini, A., & Menczer, F. (2017). Limited individual attention and online virality of low-quality information. ArXiv:1701.02694 [cs.SI]. https://arxiv.org/abs/1701.02694
Ruths, D. (2019). The misinformation machine. Science, 363(6425), 348–348. https://doi.org/10.1126/science.aaw1315
Shao, C., Ciampaglia, G., Varol, O., Yang, K.C., Flammini, A., & Menczer, F. (2018a). The spread of low-credibility content by social bots. Nature Communications, 9(1). https://doi.org/10.1038/s41467-018-06930-7
Shao, C., Hui, P. M., Wang, L., Jiang, X., Flammini, A., Menczer, F., & Ciampaglia, G. L. (2018b). Anatomy of an online misinformation network. PloS ONE, 13(4), e0196087. https://doi.org/10.1371/journal.pone.0196087
Varol, O., Ferrara, E., Davis, C. A., Menczer, F., & Flammini, A. (2017). Online human–bot interactions: Detection, estimation, and characterization. Proceedings of the 11th International AAAI Conference on Web and Social Media (ICWSM 2017), 280–289. ArXiv:1703.03107 [cs.SI]. https://arxiv.org/abs/1703.03107
Vosoughi, S., Roy, D., & Aral, S. (2018). The spread of true and false news online. Science, 359(6380), 1146–1151. https://doi.org/10.1126/science.aap9559
Weng, L., Flammini, A., Vespignani, A., & Menczer, F. (2012). Competition among memes in a world with limited attention. Scientific Reports, 2(1), 335. https://doi.org/10.1038/srep00335
Yan, H. Y., Yang, K. C., Menczer, F., & Shanahan, J. (2020, July 16). Asymmetrical perceptions of partisan political bots. New Media & Society, 1461444820942744. https://doi.org/10.1177/1461444820942744
Yang, K. C., Varol, O., Hui, P. M., & Menczer, F. (2020). Scalable and generalizable social bot detection through data selection. Proceedings of the 34th AAAI Conference on Artificial Intelligence, 34(1), 1096-1103. https://doi.org/10.1609/aaai.v34i01.5460
Zimdars, M. (2016). False, misleading, clickbait-y, and/or satirical “news” sources. https://docs.google.com/document/d/10eA5-mCZLSS4MQY5QGb5ewC3VAL6pLkT53V_81ZyitM
Funding
This research is supported in part by the Knight Foundation and Craig Newmark Philanthropies. The sponsors had no role in study design, data collection and analysis, and article preparation and publication. The contents of the article are solely the work of the authors and do not reflect the views of the sponsors.
Competing Interests
The authors declare no conflicts of interest.
Ethics
The Twitter data collection was reviewed and approved by the Indiana University Institutional Review Board (exempt protocol 1102004860).
Copyright
This is an open access article distributed under the terms of the Creative Commons Attribution License, which permits unrestricted use, distribution, and reproduction in any medium, provided that the original author and source are properly credited.
Data Availability
Replication data for this study is available via the Harvard Dataverse at https://doi.org/10.7910/DVN/6CZHH5, and at https://github.com/osome-iu/misinfo-partisanship-hksmisinforeview-2021.