Peer Reviewed
Measuring the effect of Facebook’s downranking interventions against groups and websites that repeatedly share misinformation
Article Metrics
5
CrossRef Citations
PDF Downloads
Page Views
Facebook has claimed to fight misinformation notably by reducing the virality of posts shared by “repeat offender” websites. The platform recently extended this policy to groups. We identified websites and groups that repeatedly publish false information according to fact checkers and investigated the implementation and impact of Facebook’s measures against them. Our analysis reveals a significant reduction in engagement per article/post following the publication of two or more “false” links. These results highlight the need for systematic investigation of web platforms’ measures designed to limit the spread of misinformation to better understand their effectiveness and consequences.

Research Questions
- Using available data, can we detect when Facebook has started reducing the visibility of groups repeatedly sharing misinformation?
- Can we quantify the effects of Facebook’s policy to reduce the visibility of groups and websites repeatedly sharing misinformation?
- Does this policy impact the total engagement received on posts from these websites and groups, and does it change their posting behavior?
Essay Summary
- According to Facebook, groups and websites that repeatedly share misinformation will have their visibility reduced, but little is known about the implementation and the impact of this policy.
- We combined data from CrowdTangle, BuzzSumo, and two fact-checking datasets to measure Facebook users’ engagement with content created by accounts repeatedly sharing misinformation.
- For groups repeatedly sharing misinformation, we observed a significant reduction in engagement per post of 16% to 31% depending on the methodology used to identify them. We did not observe a substantial change of the posting behavior in terms of posts volume and proportion of low-quality links shared within posts, and the total engagement generated by repeat offender groups does not decrease over time.
- Facebook users’ engagement per article from websites with two or more articles marked as false by fact checkers decreased by about 45%, suggesting that posts containing a link to these websites were downranked by Facebook. Websites display similar patterns of total engagement generated on Facebook and Twitter, so one cannot conclude that Facebook’s policy leads to reducing their engagement in the long run.
- The present study highlights the importance of accessing platforms’ data to enable external agents (e.g., researchers, journalists, etc.) to successfully monitor and audit misinformation interventions and their impact.
Implications
The spread of misinformation on online platforms is a growing concern in society, and experts have increasingly highlighted platforms’ responsibility in addressing the issue (Misinformation, conspiracy theories, and “infodemics,” 2020). In particular, Facebook posts from “misinformation” news providers have been shown to receive consistently higher engagement than “non-misinformation” (Edelson et al., 2021). To tackle misinformation, Facebook has announced many policies and interventions over the past few years (see Rosen, 2021).
Contextual labels and banners applied to misleading posts have been studied in previous research (e.g., Sanderson et al., 2021), but little is known about the effectiveness of interventions consisting in removing or downranking content from unreliable sources (Saltz et al., 2021). To fill this gap, the present research investigates the downranking intervention that Facebook has introduced in these terms: “Pages, groups, accounts and websites that repeatedly share misinformation will face some restrictions, including having their distribution reduced” (Meta, n.d.). “Groups” refer to discussion-based environments on Facebook typically organized around one topic, while “pages”refer to public-facing Facebook channels used by a publisher to share updates (Facebook, n.d.). Facebook ranks each post in users’ news feed by assigning a relevance score to it. A high rank leads to a high likelihood of the post appearing at the top of a user’s news feed (Lyons, 2018). By downranking its posts, Facebook can make an entire page or group less visible. A website’s visibility can also be reduced by downranking all the Facebook posts containing a link to it.
Théro and Vincent (2022) analyzed engagement data and showed that the engagement on posts from Facebook pages temporarily decreased by about 50% after they shared misinformation twice, but that drop in engagement was not observed among Facebook groups over the 2019–2020 period. This article investigates the implementation of Facebook’s “reduced distribution” policy on groups, as it has come into force recently, and on websites, as it has not yet been studied.
Facebook announced the enforcement of a “reduced distribution” policy for groups in September 2020 (Alison, 2020) and added groups as a target of the policy to their help center during the spring of 2021 (see Business Help Center, 2021 February, in which Facebook only mentions ”pages and websites,” not groups), but the exact date of its enforcement is not publicly available. We were able to track when the policy was first tested and when it was more widely deployed by searching for messages posted by groups mentioning that their distribution was reduced. Platforms’ announcements of misinformation-related interventions often lack details on how and when the measures are exactly implemented (Krishnan et al., 2021). Our methods for searching for accounts speaking about a specific restriction can be generalized to other policies and platforms.
We identified websites that repeatedly shared misinformation between 2019 and 2021 according to fact checkers partnering with Facebook. We observed a significant decrease in the number of Facebook engagements per article published by websites that had shared two or more URLs flagged as false in less than 90 days, placing them under a presumptive “repeat offender” status, with a median decrease of 41% to 47% in engagement depending on the fact-checking dataset used. We observe that Facebook groups, when they are under a presumptive repeat offender status, saw their engagement per post decrease by a median of 31%. Groups for which an admin posted that they were under a “reduced distribution” status saw a median decrease of their engagement per post of 16%. Based on simple metrics, these groups do not appear to change their posting behavior after receiving a notification from Facebook. In particular, the median share of posts containing a link to a website rated as low or very-low credibility by mediabiasfactcheck.com (MBFC) is around 10% both before and after the notification. Further qualitative research is needed to get a better understanding of how websites, groups, and pages react to being subjected to Facebook’s misinformation interventions.
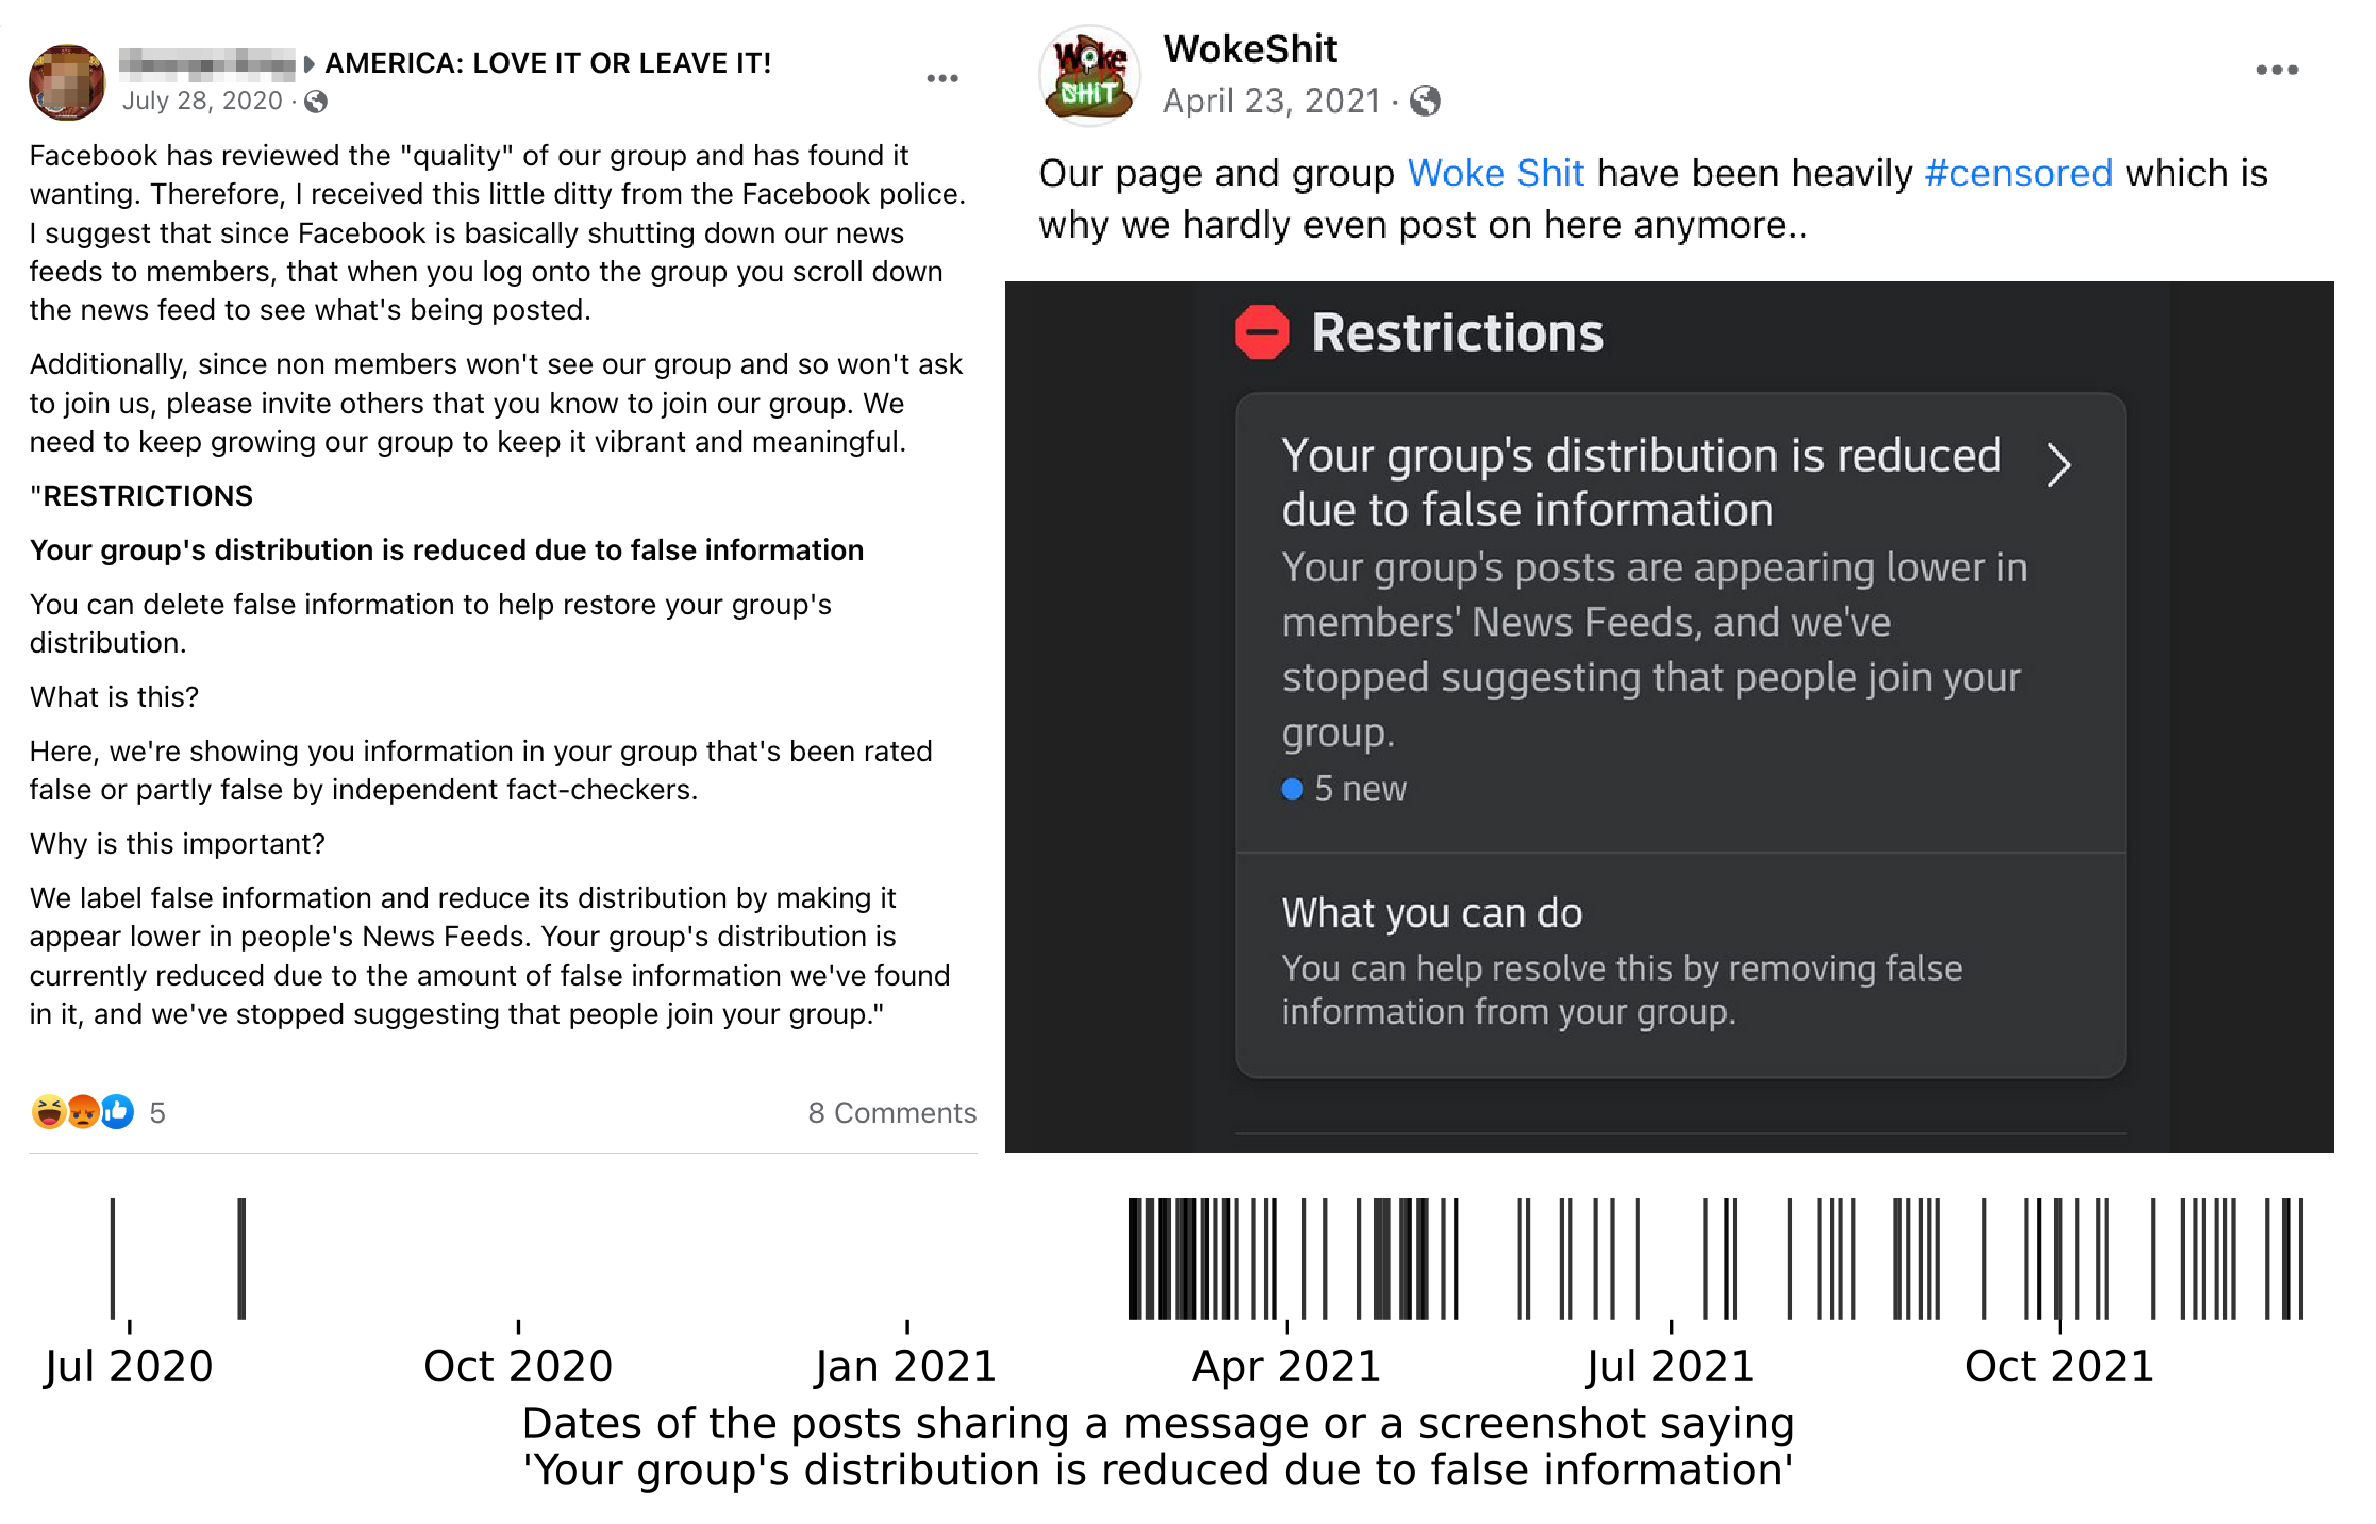
While we observed a substantial reduction in engagement per post in the short term, we observed that the total number of engagements generated per day on content from these websites/groups does not decrease in the long run. Even though it is short-lived, the magnitude of the reduction resulting from this policy is substantial. For reference, Guess et al. (2020) showed that providing “tips” on how to spot false news to social media users in the United States improved their discernment between mainstream and false news headlines by 26.5%. Bak-Coleman et al. (2022) formalized a model of viral misinformation spread and by applying it to a corpus of misinformation events, they estimate that combining several policies such as fact-checking, behavioral nudges, and banning repeat offenders could reduce the prevalence of misinformation in users’ feeds by an estimated 50%. It should be noted that groups can easily evade the consequences of Facebook’s policy, given that an admin deleting the offending content is enough to cancel the strike against the group (Facebook’s message to admins indeed reads: “You can delete false information to help restore your group’s distribution.” See Figure 1).
At a time when platforms are announcing new interventions to tackle online misinformation (Yadav, 2021) and a large proportion of their users report having been exposed to such interventions (Saltz et al., 2021), there is a critical need to further monitor their implementation and to assess their impact, effectiveness, and acceptability.
Reducing the algorithmic amplification of content from known misinformation sources and promoting more reliable sources appears to be a promising approach to tackling misinformation at scale. However, the rules put in place by Facebook could be gamed by recurrent publishers of misinformation as group admins can simply delete offending posts, and Facebook page or website owners can have their strike removed by appending a “correction” to their post. To avoid these shortcomings, we recommend that Facebook takes into account these removed strikes, as a half-strike for instance. In addition, Facebook’s “repeat offender” policy considers the strikes of an account over a short period of 90 days. To better regulate the spread of misinformation in the long run, the company should consider the behavior of actors over longer periods: for instance by changing their “2 strikes in 90 days” policy into a “2 strikes in 180 days” policy and/or by extending it into a “2n strikes in 180n days” policy, so an account would also be a repeat offender if it shared four false news in 360 days and so on, which would take into account all information available about the account’s past behavior.
Findings
Finding 1: Facebook started enforcing its repeat offender policy against groups in February 2021.
In September 2020, Facebook announced it would start enforcing its repeat offender policy on groups. Our first goal was to verify when and how this new regulation was implemented. To identify repeat offender groups, our first approach was to search for posts that shared a message or a screenshot of Facebook’s notification, which reads “Your group’s distribution is reduced due to false information.” We identified 100 posts, whose publication dates are displayed on the bottom panel of Figure 1. Most posts were published after February 23, 2021. However, there are three outliers before this date, corresponding to three groups claiming to be under reduced distribution on June 27, July 27, and July 28, 2020. This suggests that Facebook may have A/B tested its measure on a subset of groups in the summer of 2020, before announcing the policy publicly in the fall of 2020, and starting to enforce it at scale in February 2021.
Finding 2: Facebook groups repeatedly sharing misinformation had their engagement per post reduced in 2021.
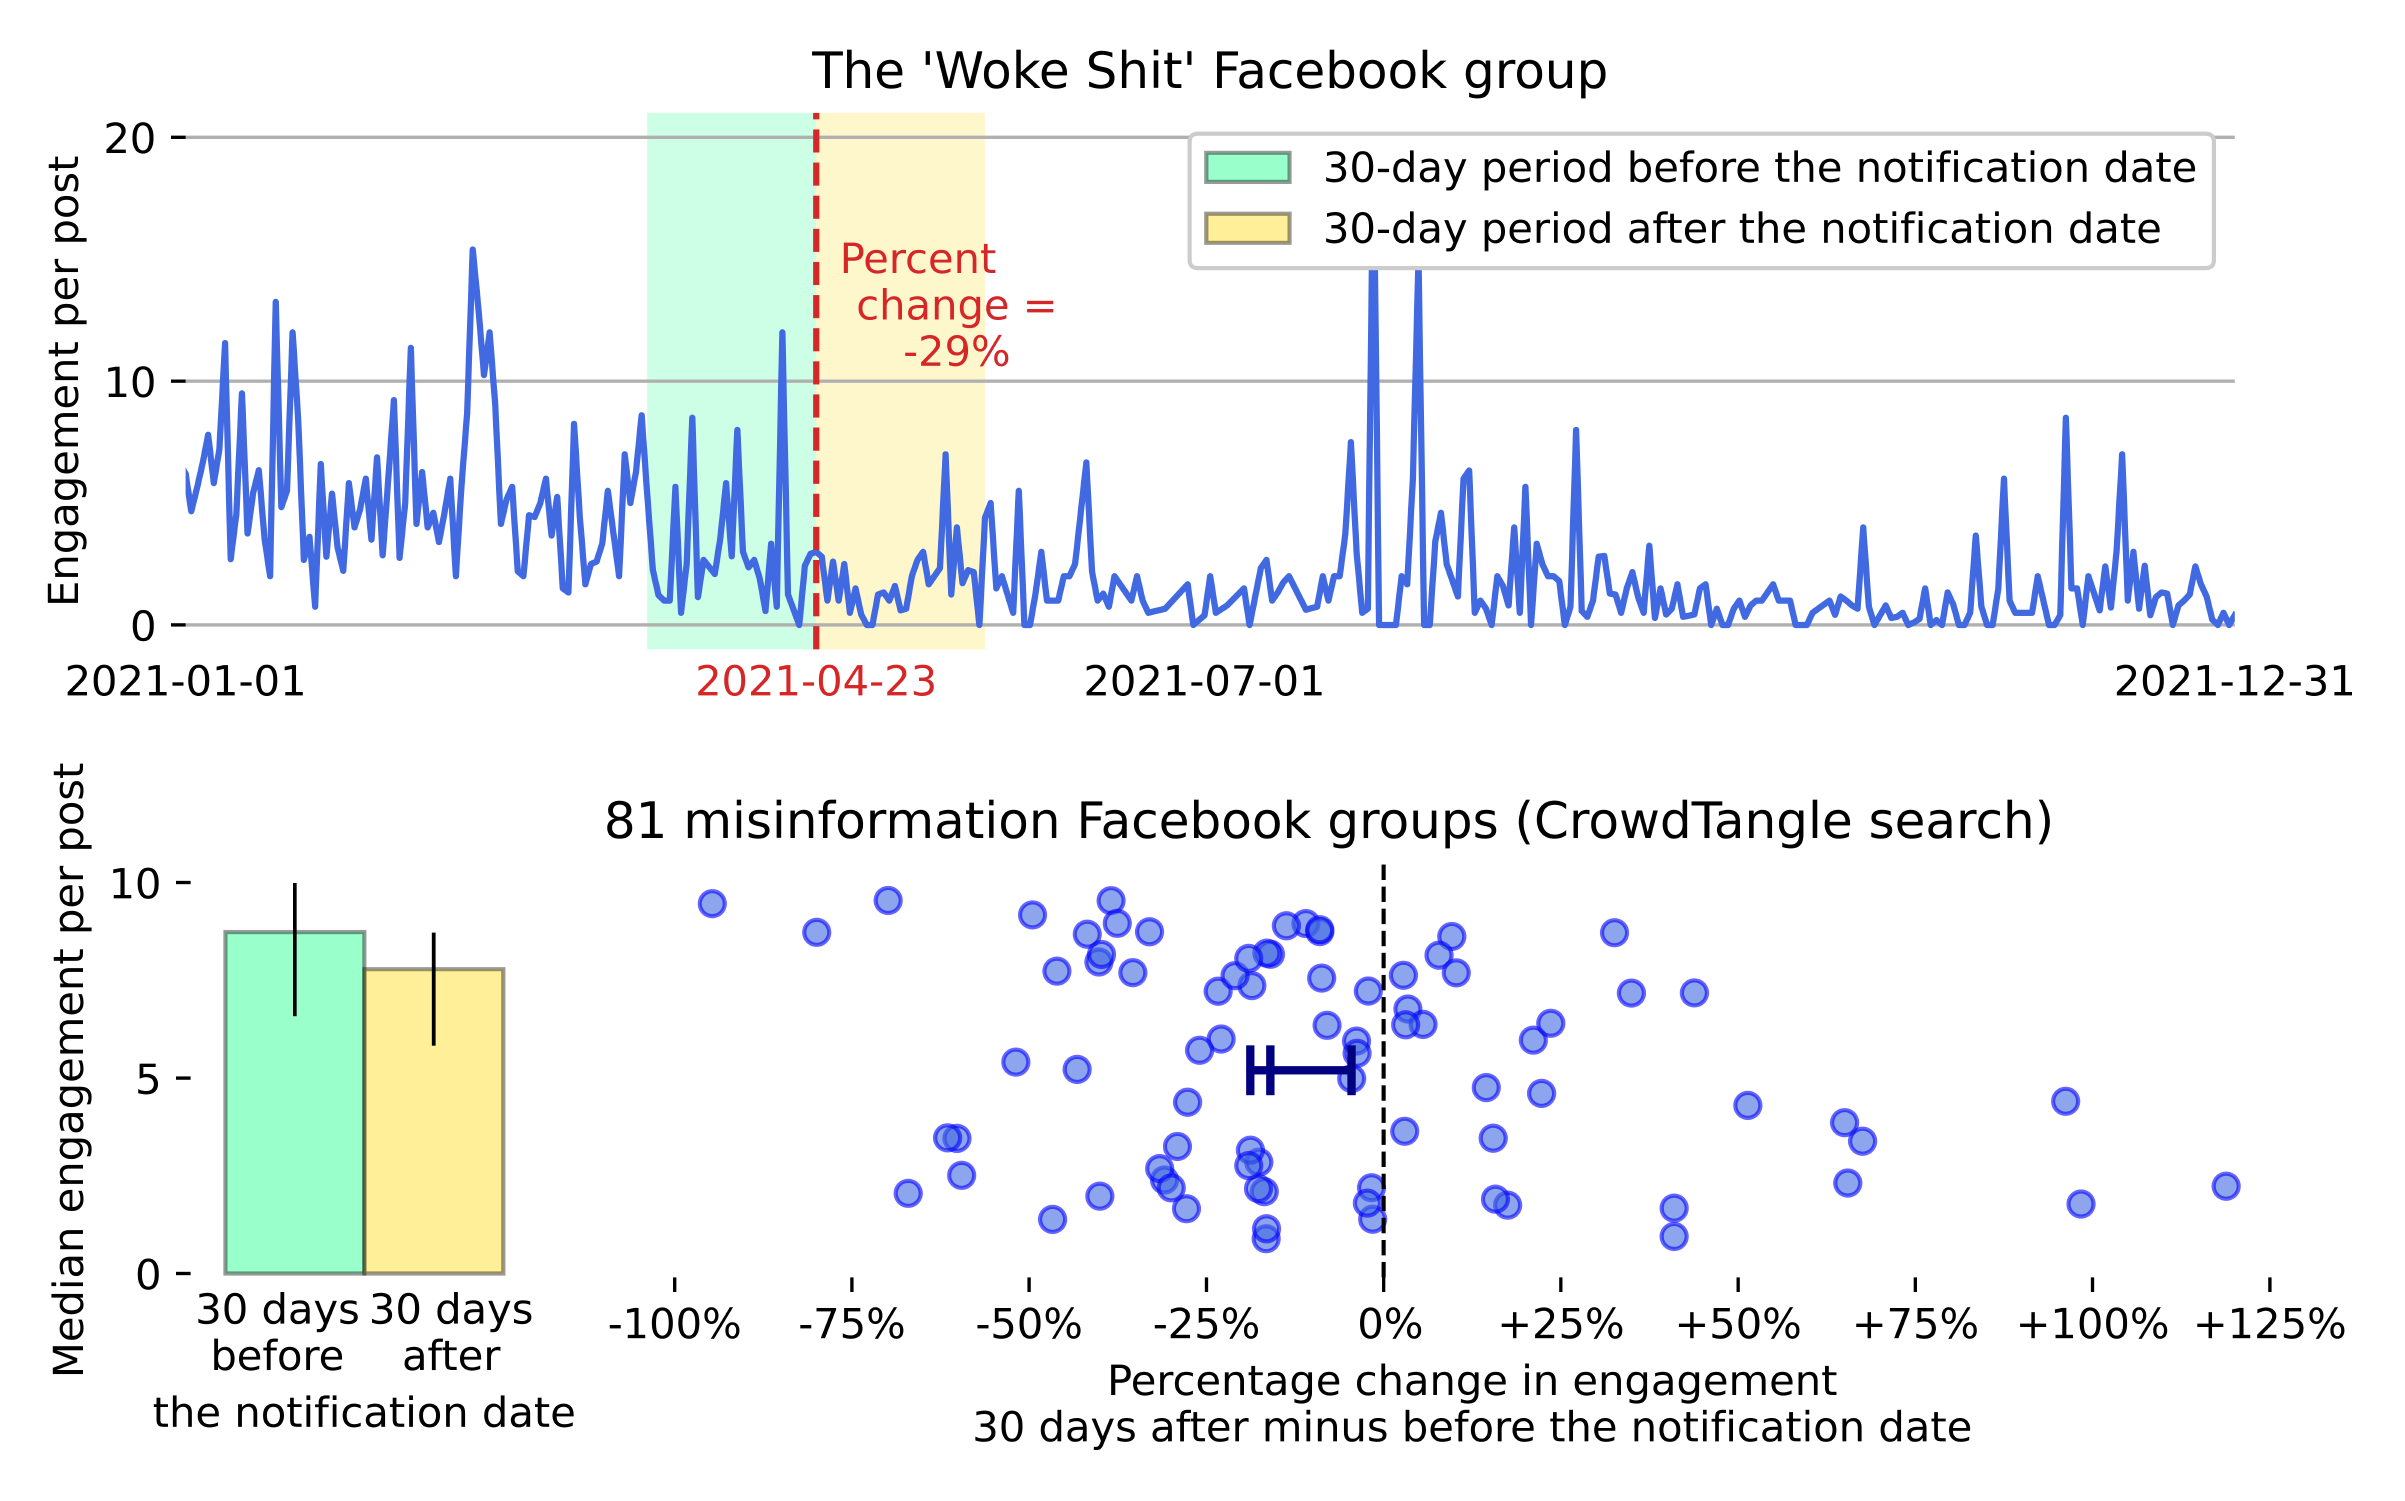
If Facebook decreased the visibility of a group’s posts in users’ news feeds, we expected this measure to be quantifiable by metrics related to the group’s posts views. But since we did not have access to the count of views, we used as a proxy the engagement per post, defined as the sum of user reactions to a post: likes, shares, andcomments. To measure the policy’s effect, we calculated the percent change in engagement during a 30-day period after minus before the notification date. As an example, the Facebook group “Woke Shit” shared a reduced distribution notification from Facebook on April 23, 2021 (Figure 1). When we compared their engagement per post during a 30-day period before and after this date, the percent change was -29% (Figure 2, top panel).
For all groups, the median percent change between the two periods is -16%, and a Wilcoxon test indicated that the percent changes are significantly different from zero, W = 1117, p = 0.010 (Figure 2, bottom panels). Groups declaring to be reduced thus exhibit a modest decrease in engagement on their posts. This is a self-selecting set of groups who chose to speak publicly about Facebook’s policy; it might not be representative of all groups.
To see if we could reproduce this result with a different set of groups, we used another approach to identify groups repeatedly sharing misinformation. We used a dataset of fact-checked URLs obtained from Science Feedback, one of Facebook’s fact-checking partners, and listed all the URLs they flagged as false. We then identified all the Facebook public posts sharing a link to one of these URLs using CrowdTangle and identified 138 public groups that repeatedly shared false information in 2021.
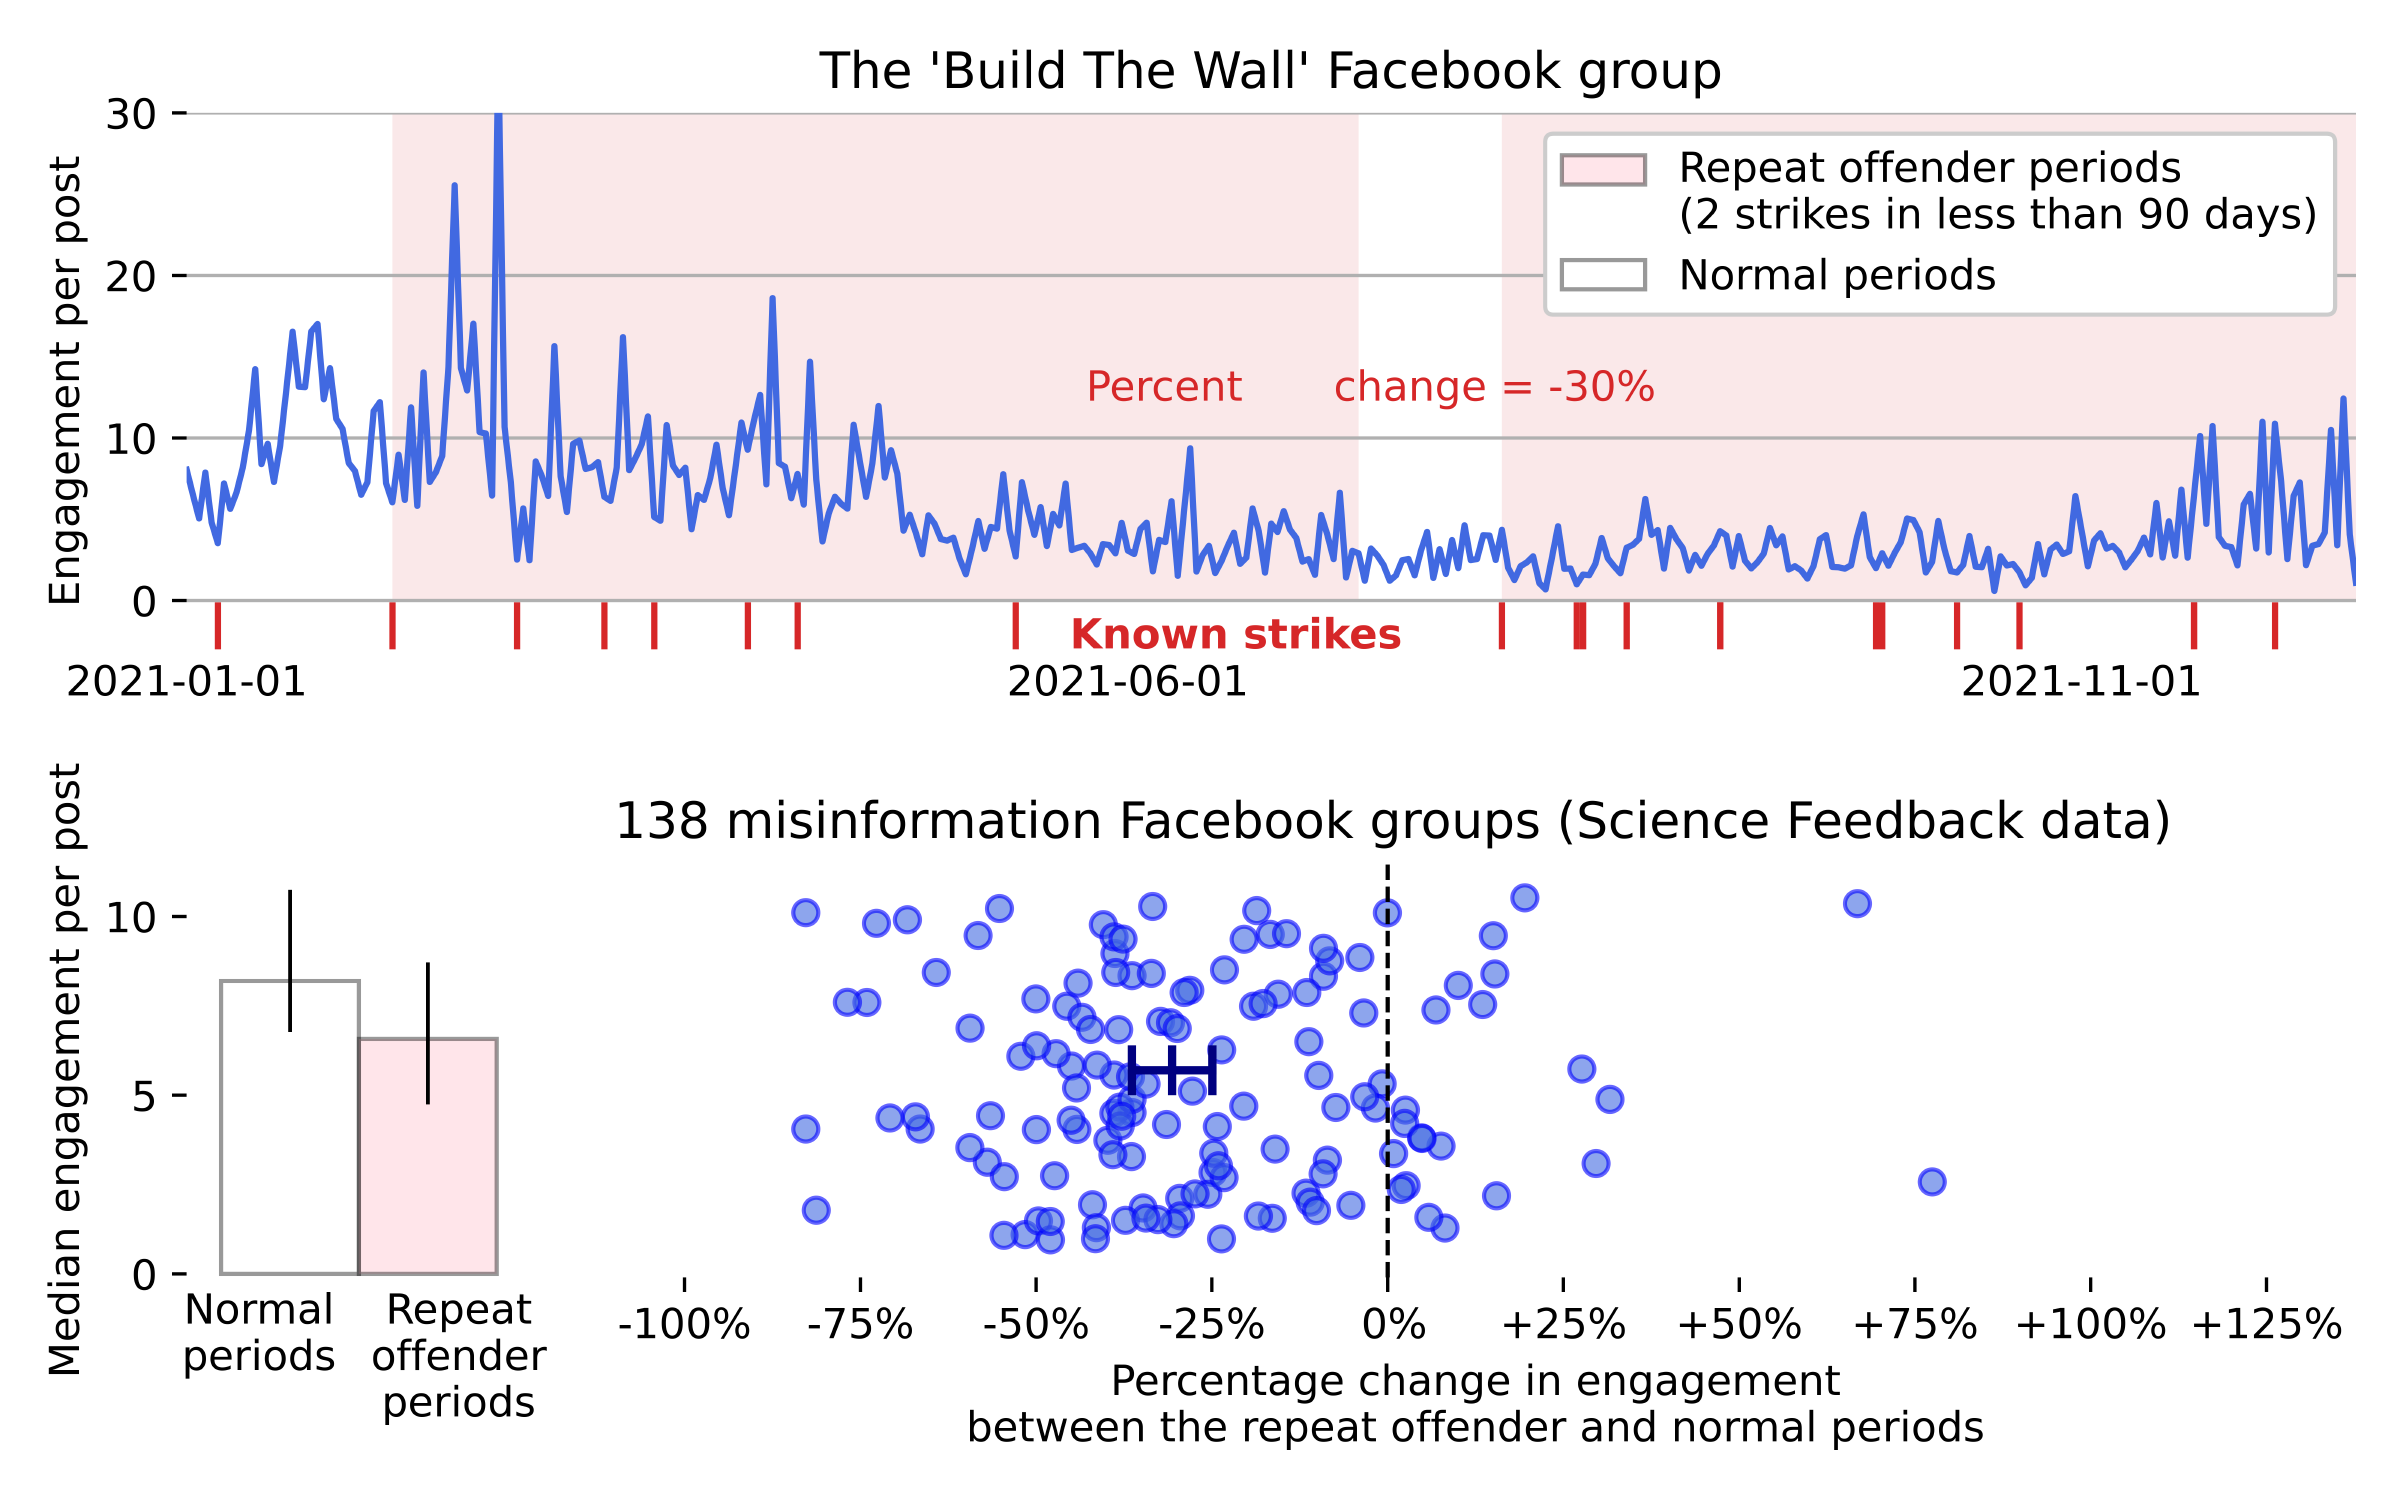
A Facebook staff member indicated to a journalist that: “Two strikes in 90 days places an account into ‘repeat offender’ status, which can lead to a reduction in distribution of the account’s content” (Solon, 2020). In this article, we considered that each false URL resulted in a strike against the account and used the “two strikes in 90 days” rule to identify repeat offender periods. A repeat offender period is thus defined as any given time in which a group has shared two or more “false news links” over the past 90 days (see Figure 3, top panel for one example).
We calculated the percent change in engagement between the repeat offender periods and the rest of the time for each of the 138 new groups identified. The median percent change between the two periods is -31%, and a Wilcoxon test indicated that the values are significantly different from zero, W = 784, p = 1.5 x 10⁻¹⁷ (Figure 3, bottom panels). Our observations confirm that Facebook has implemented its repeat offender policy on groups in 2021 while it wasn’t enforced in 2019–2020 (Théro & Vincent, 2022).
Finding 3: The Facebook groups that received a Facebook notification have not substantially changed their posting behavior in terms of volume and quality of content.
We wished to investigate whether accounts that are being targeted by a downranking policy change their posting behavior. Here we limited the analysis to the 81 groups that had shared a post mentioning the Facebook reduced distribution notification, because receiving and speaking about such a notification indicates that the group admins are well aware that they have been targeted by the intervention.
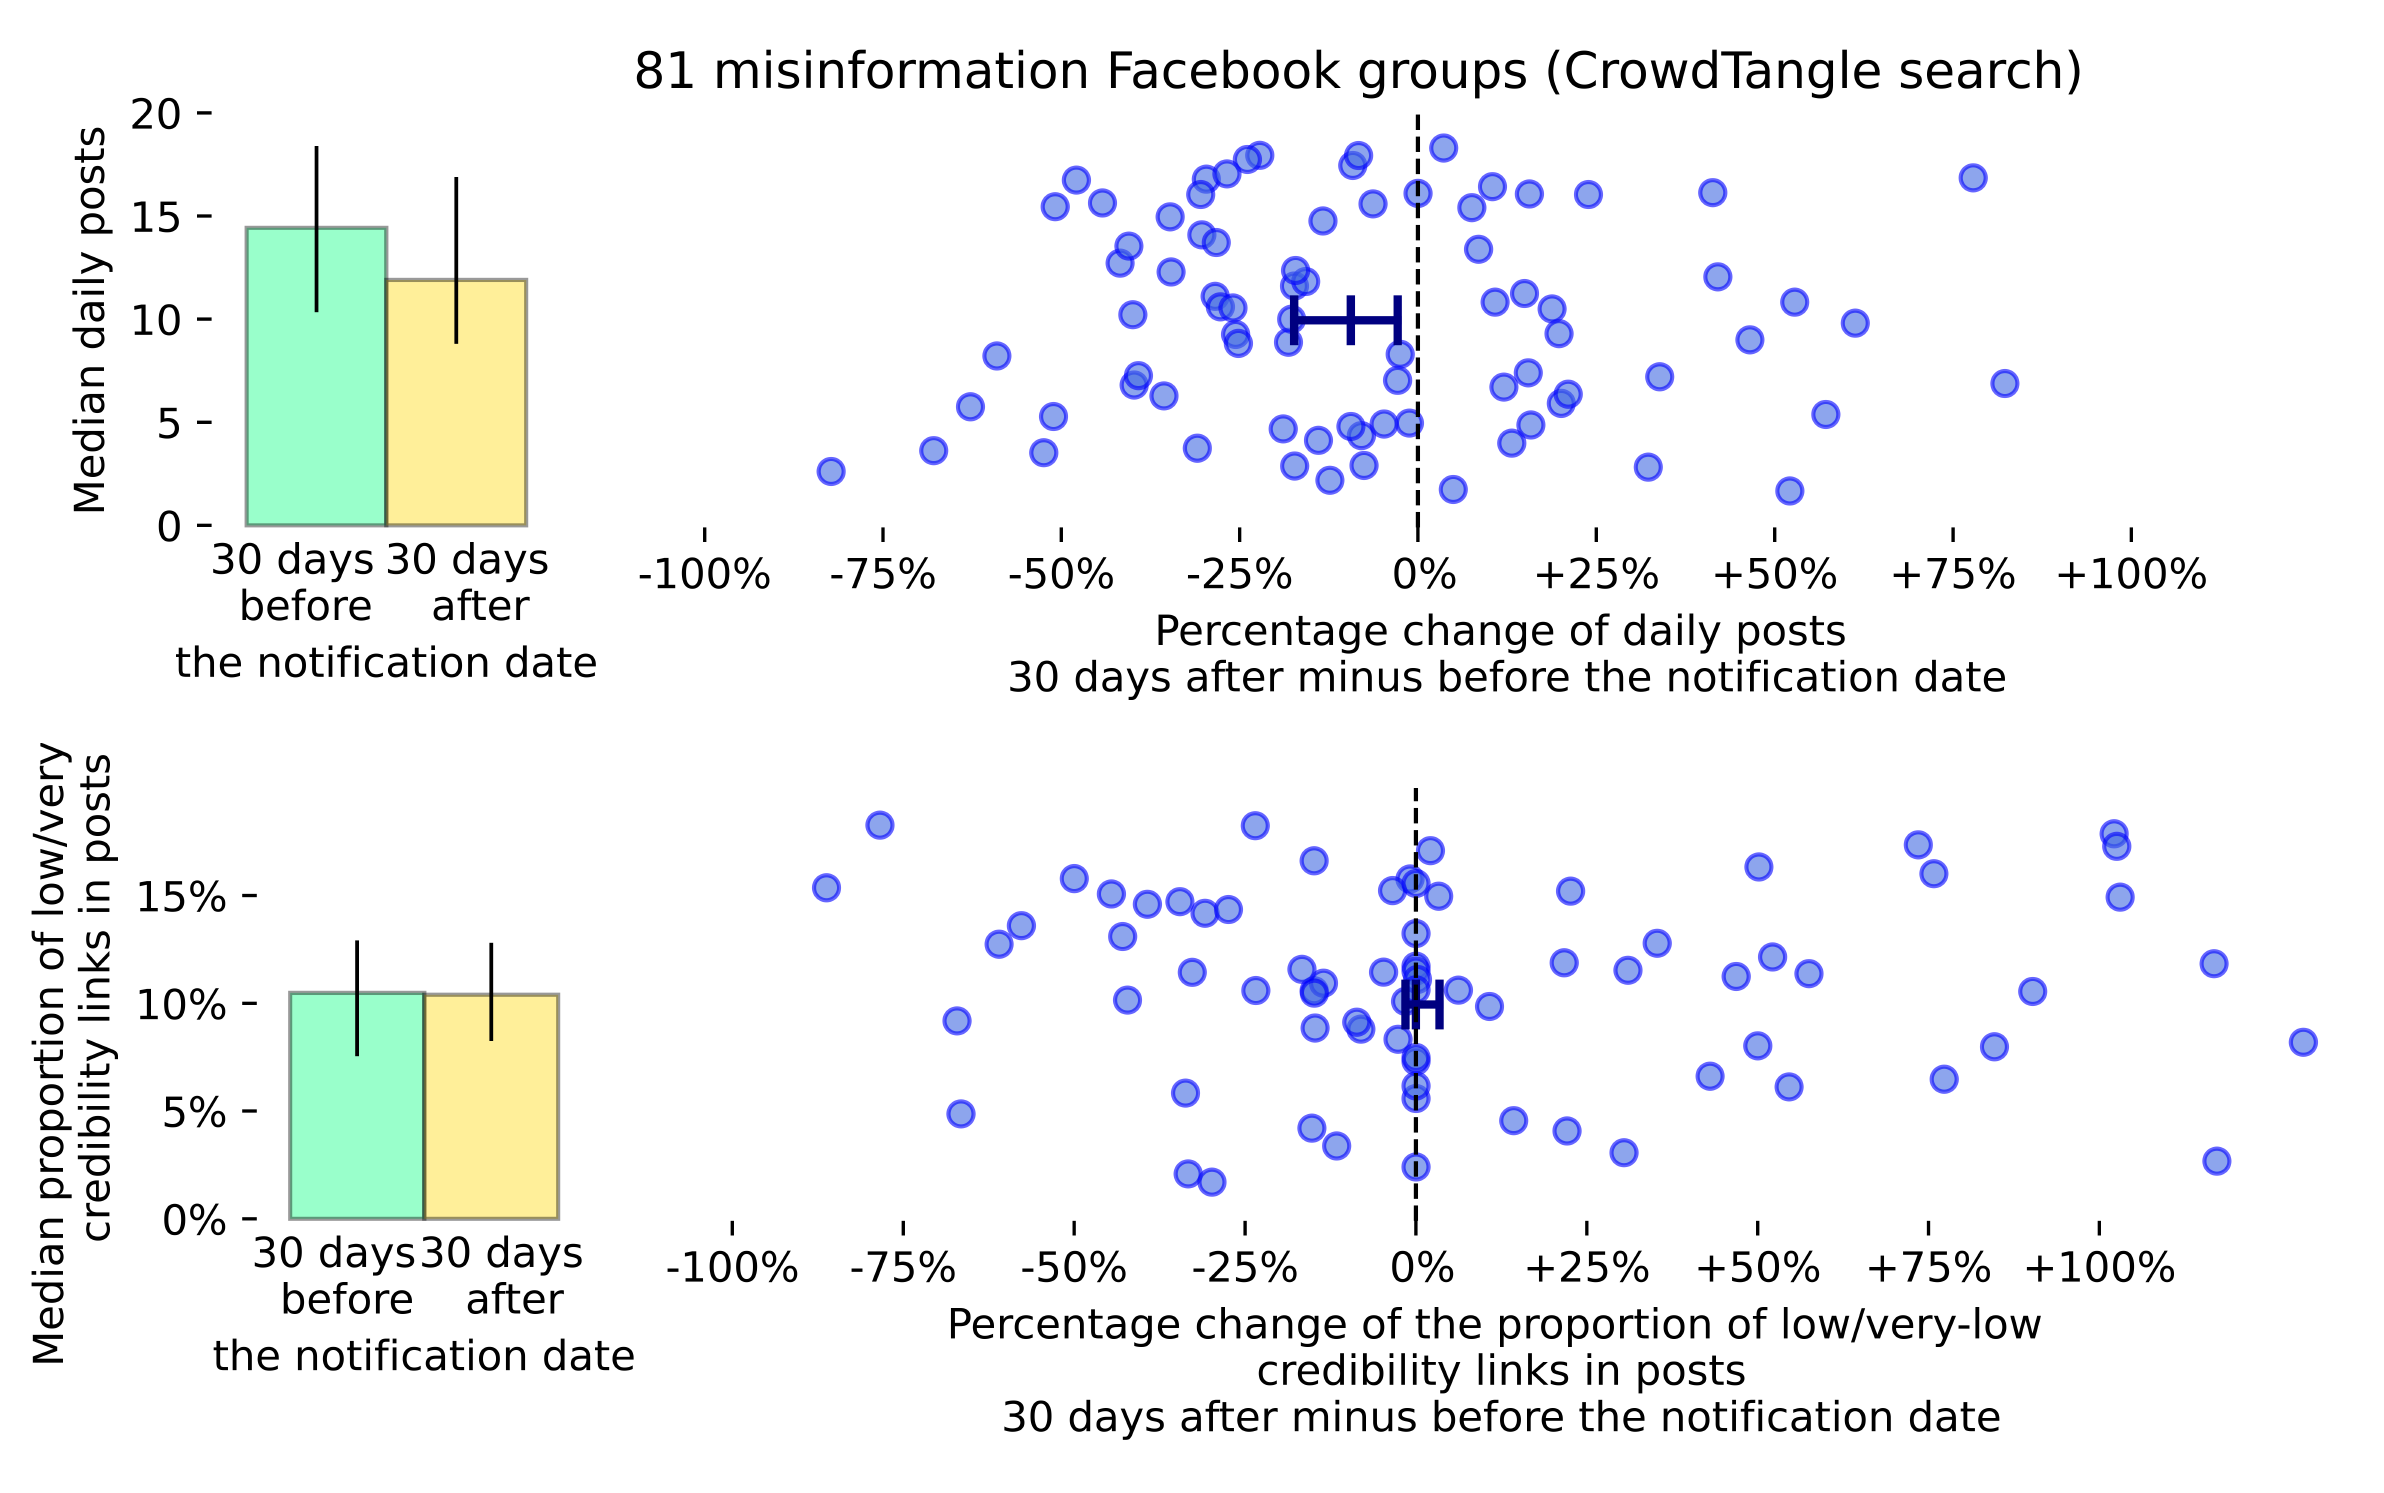
We studied the change of two simple metrics before and after the notification date: (i) the volume of posted content, and (ii) the share of posts containing a link to low or very-low credibility websites according to the MBFC Factual Reporting metric (see Appendix B for details). We found that the median number of posts per day over 30 days before the notification is 14.4, against a median of 11.9 posts per day during the 30-day period after the notification. A Wilcoxon test shows that this change is not significant at the 5% level but is significant at the 10% level, W = 1249.5, p = 0.0755. Furthermore, we found that the median of the proportion of links redirecting to low credibility websites (for posts containing a link) is 10% both before and after the notification date, W = 990, p = 0.7376.
Hence, there doesn’t seem to be a substantial change in posting behavior when considering the posting volume and the credibility of websites shared. Further qualitative research is needed to better understand the behavior of agents targeted by misinformation policy, such as whether they develop evasion strategies.
Finding 4: Websites repeatedly sharing misinformation had their Facebook engagement per article reduced in 2019–2021.
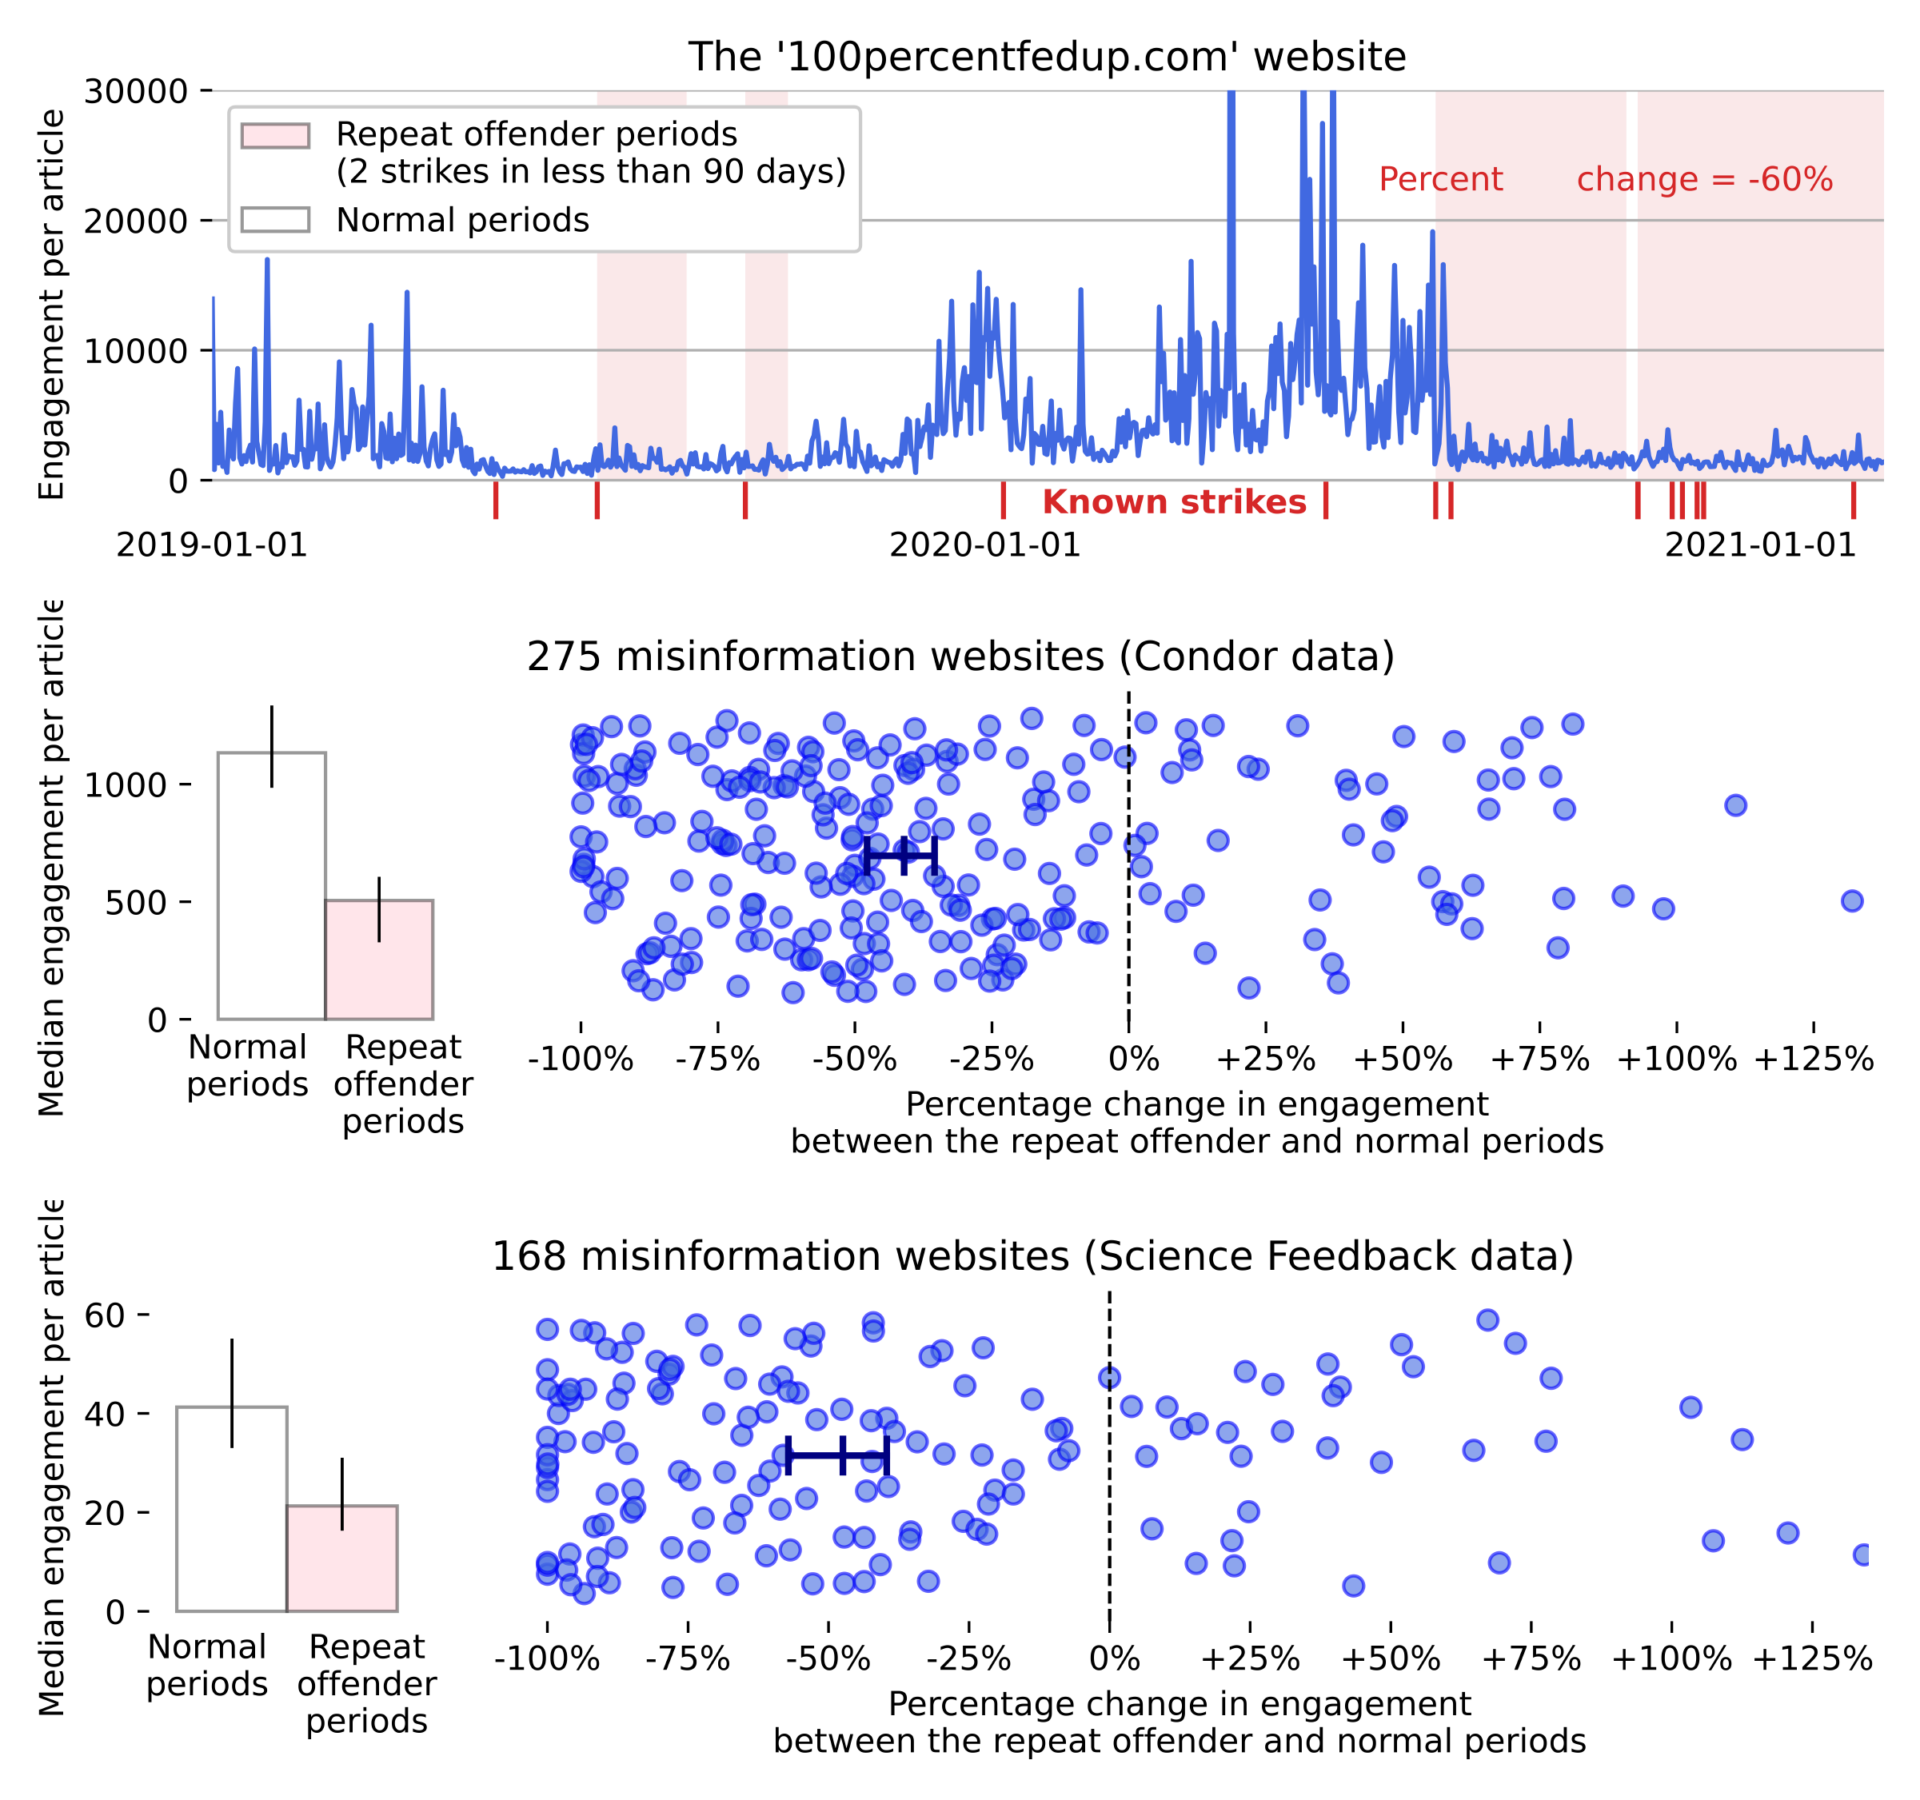
The implementation of Facebook’s repeat offender policy was tested on groups above and on pages by Théro & Vincent (2022), but it has not been verified on websites yet. We used BuzzSumo to retrieve the Facebook engagement per article for a given website. The Condor dataset (Messing et al., 2021) lists URLs shared more than 100 times that were flagged as false by one of Facebook’s fact-checking partners. A website was considered a repeat offender when fact-checkers marked at least two of its articles as false within a 90-days period (Figure 5, top panel).
The median engagement per article for the 275 websites is 505 during the repeat offender periods, and 1,133 during the normal periods. We calculated the percent change in engagement between the repeat offender periods and the normal periods for each of the 275 websites that published at least one article during each period. The median percent change is -41%, and a Wilcoxon test indicated that the values are significantly different from zero, W = 10703, p = 3.7 x 10⁻¹⁰ (Figure 5, middle panel). So, we did observe a significant decrease in engagement per article in line with Facebook’s stated policy.
To verify the reproducibility of this result, we used the Science Feedback fact-checking dataset. While the Condor dataset only contains URLs shared at least 100 times on Facebook, the Science Feedback dataset contains URLs regardless of their share number, which allowed us to identify websites with a smaller audience. The median engagement per article for the 168 newly identified websites was 21 during the repeat offender periods, and 41 during the normal periods. For each website, we calculated the percent change in engagement between the repeat offender and the normal periods. The median percent change is -47%, significantly different from zero, W = 4221, p = 5.2 x 10⁻⁶ (Figure 5, bottom panel).
Finding 5: We did not observe a decrease in the overall engagement generated on content shared by repeat offenders in the long run.
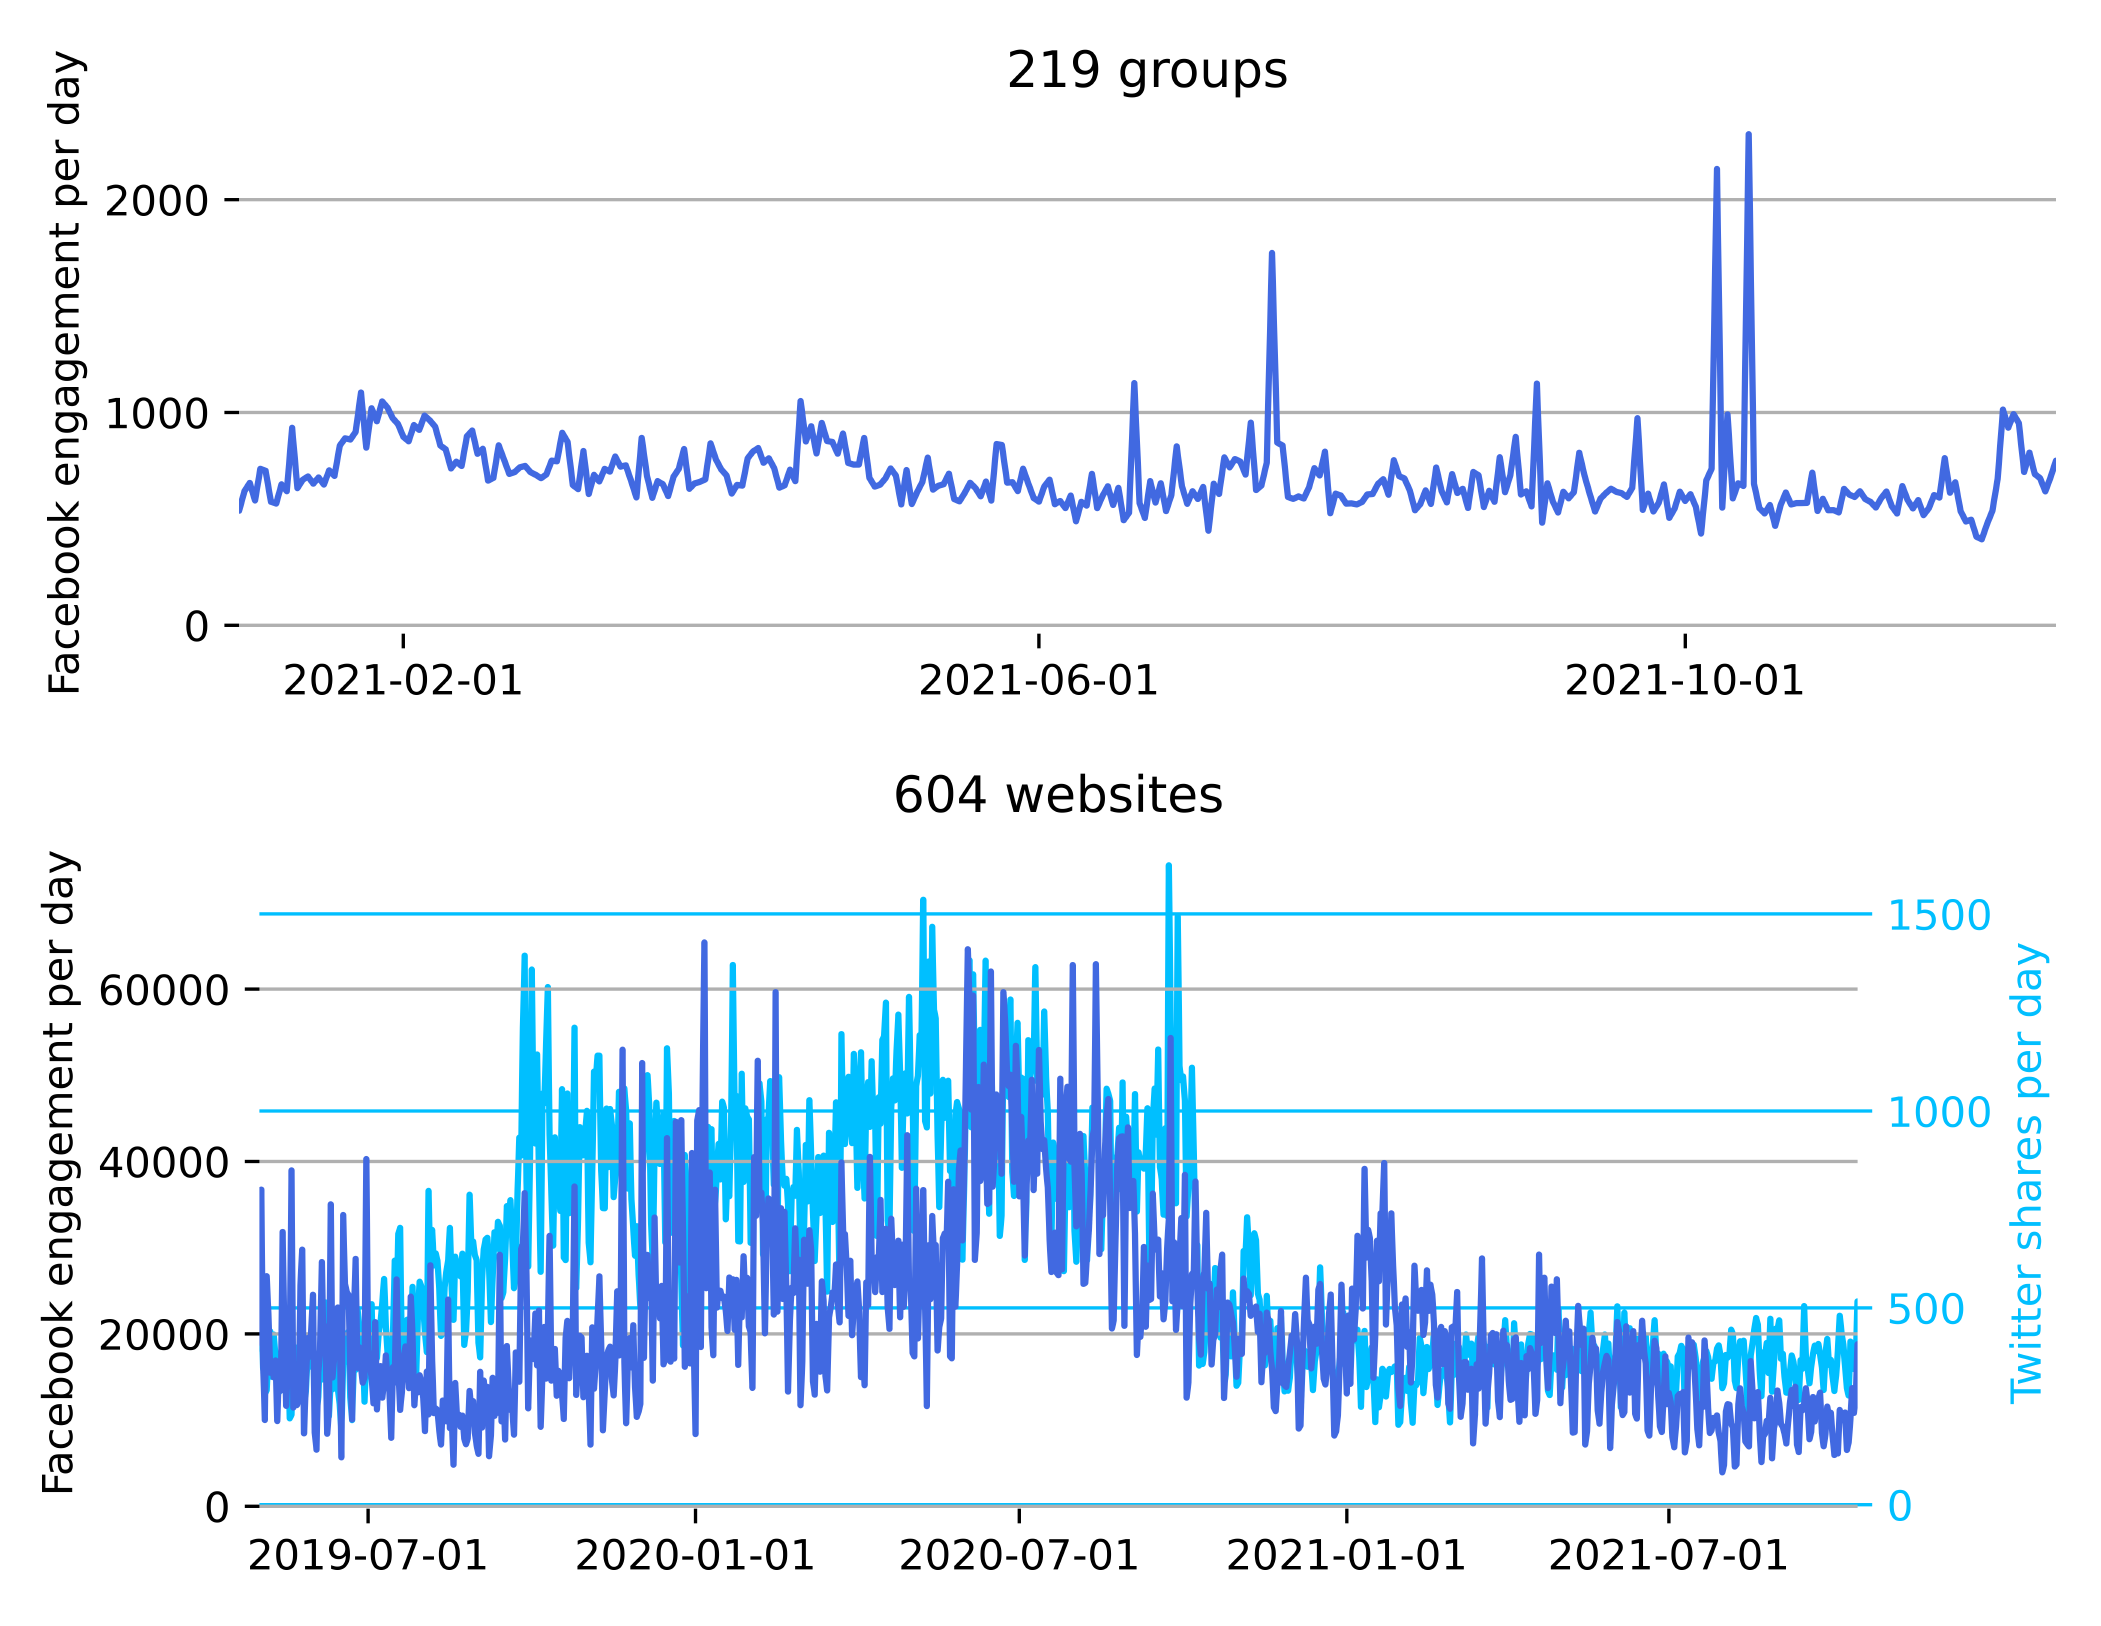
To investigate the long-term impact of Facebook’s policy, we studied the daily total number of engagements on the content of repeat offender accounts. For groups, their total number of engagements displayed no trend throughout 2021 (Figure 6 top panel). This suggests that Facebook’s policy does not result in an overall decrease in engagement on content shared in groups repeatedly sharing misinformation.
Alongside Facebook engagement per article, Buzzsumo also provided us with the Twitter shares per article (the number of tweets and retweets sharing the article). The total engagement on posts/tweets sharing a link to repeat offender websites displays an increase until mid-2020 and a decrease until the end of 2021 (Figure 6, bottom panel). This finding could have suggested the decrease was a consequence of Facebook’s policy against misinformation websites; however, the fact that Twitter engagement data displayed the same pattern suggests the decrease was caused by another factor, except if the two platforms took similar actions against these websites. This is unlikely, as Twitter does not have a partnership with fact checkers, unlike Facebook.
Methods
Working hypotheses and limitations
We used CrowdTangle, a public insights tool owned by Facebook, and BuzzSumo, a commercial database that tracks the volume of user interactions on social media platforms. These two APIs provide access to engagement metrics (the number of likes, shares, and comments) but not to the number of views. We calculated the engagement per post/article from CrowdTangle/Buzzsumo by summing the number of comments, shares, and reactions (such as “like,” “love,” and “angry” reactions) that each post/article received. It should be noted that CrowdTangle only tracks public content (posts from pages and public groups) but not content from private groups and users, while BuzzSumo aggregates for each media article the engagement metrics from all Facebook accounts, both public and private.
The methodology we used to infer the repeat offender periods could only approximately infer the periods when websites or groups should be under an actual repeat offender status because the fact-checking datasets we used do not contain all the data available to Facebook. Our different methods still yielded results that are consistent with previous findings (Théro & Vincent, 2022), but the reduction amplitudes reported here are likely to underestimate the true effect of Facebook’s reduction interventions.
The Condor dataset used contains URLs flagged as false between January 2018 and February 2021. Because Facebook only started to visibly apply its reduction policy to groups in late February 2021, Condor data could not be used to identify repeat offender groups.
Data collection for Facebook groups
In the spring of 2021, we observed a Facebook group that shared a screenshot claiming it was under reduced distribution and set out to gather other similar groups by searching CrowdTangle for posts published after January 1, 2016, containing the sentence, “Your group’s distribution is reduced due to false information.” We launched the query on December 1, 2021, and manually opened the resulting 122 posts, keeping the ones that met the following criteria (see Figure 1, top panels for examples):
- The post message or image contains “Your group’s distribution is reduced due to false information”
- The message is posted in a public group by an admin (as verified in the group’s “about” page)
- The message shows that the notification concerns this group and is not just informative (e.g., we excluded a post saying “Facebook introduces new censorship and punishment measures for groups and their members…”)
After filtering, 100 posts remained, corresponding to 86 self-reported groups under reduced distribution. To verify the consequences following Facebook notifying these groups, we collected all their posts published in 2020 and 2021 using the ‘posts’ endpoint of CrowdTangle API. The collection was run on January 3, 2022, on 81 groups as some were deleted or changed to private in the meantime. For the groups that posted multiple messages, all the dates of the posts are displayed on the bottom panel of Figure 1, but only the earliest is used to infer the reduced distribution start date to calculate the percent changes shown in Figure 2.
We also identified groups using Science Feedback data. The dataset was extracted on December 15, 2021 to obtain the 2,760 URLs flagged as false in 2021; the data is available to scientists studying misinformation atopen.feedback.org. We collected from CrowdTangle all the public posts made in a group that shared one of those links. We identified the groups that spread misinformation the most often, selecting the 142 groups that shared at least 20 different false URLs. We collected all the posts they published between January 1 and December 15, 2021. Among those groups, four were already present in the previous sample and were excluded from the replication analysis.
Data collection for websites
We used the June 2021 version of the Condor dataset (aka “Facebook Privacy-Protected Full URLs Data Set”), which contains all the URLs shared at least 100 times on the platform between January 1, 2017, and February 28, 2021, along with their fact-checking metadata (Messing et al., 2021). We extracted the 7,478 URLs that were shared since 2019 and flagged as false, and the country in which it was shared the most was the USA, Canada, Great Britain, or Australia. We listed the 710 websites with at least two false URLs, manually excluding platforms (e.g., youtube.com) and archive websites (e.g., archive.org) on which we understand Facebook isn’t enforcing its policy. We used the BuzzSumo API to collect the number of articles from each website between January 1, 2019, and February 28, 2021, using the “articles” endpoint. We excluded the websites with fewer than 100 articles in total and websites with over 100,000 articles as our number of calls was limited, which yielded 371 remaining websites whose social media data was collected using the same endpoint. The 275 websites shown in the middle panels of Figure 5 are the websites that published at least one article during the repeat offender and normal periods.
Science Feedback data was extracted on October 21, 2021, and used to identify the 4,810 URLs flagged as false between April 18, 2019 (the date of the first entry), and October 15, 2021, yielding 476 unique websites with at least two false URLs. As above, we kept the sites that were not platforms and that had between 100 and 100,000 articles in BuzzSumo, resulting in 388 websites. We then collected the social media data of all of their articles from 2020 and 2021. The websites already associated with the Condor dataset (shown in Figure 5, middle panels) were excluded from the replication analysis (Figure 5, bottom panels).
Topics
Bibliography
Alison, T. (2020, September 17). Our latest steps to keep Facebook groups safe. Facebook Newsroom. https://about.fb.com/news/2020/09/keeping-facebook-groups-safe/
Bak-Coleman, J. B., Kennedy, I., Wack, M., Beers, A., Schafer, J. S., Spiro, E., Starbird, K., & West, J. (2022). Combining interventions to reduce the spread of viral misinformation. SocArXiv. https://doi.org/10.31235/osf.io/4jtvm
Business Help Center. (2021, February). Fact-checking on Facebook. https://web.archive.org/web/20210225070043/https://www.facebook.com/business/help/2593586717571940
Misinformation, conspiracy theories, and “infodemics”: Stopping the spread online: Hearing before the U.S. House of Representatives Permanent Select Committee on Intelligence, 116th Cong. (2020). https://www.congress.gov/116/meeting/house/111087/documents/HHRG-116-IG00-Transcript-20201015.pdf
Edelson, L., Nguyen, M. K., Goldstein, I., Goga, O., McCoy, D., & Lauinger, T. (2021). Understanding engagement with US (mis) information news sources on Facebook. In Proceedings of the 21st ACM Internet Measurement Conference (pp. 444–463). https://doi.org/10.1145/3487552.3487859
Facebook. (n.d.). What’s the difference between a profile, page and group on Facebook? Facebook Help Center. https://www.facebook.com/help/337881706729661/
Guess, A. M., Lerner, M., Lyons, B. (2020) A digital media literacy intervention increases discernment between mainstream and false news in the United States and India. Proceedings of the National Academy of Sciences, 117(27), 15536–15545. https://doi.org/10.1073/pnas.1920498117
Krishnan, N., Gu, J., Tromble, R., & Abroms, L. C. (2021). Research note: Examining how various social media platforms have responded to COVID-19 misinformation. Harvard Kennedy School (HKS) Misinformation Review, 2(6). https://doi.org/10.37016/mr-2020-85
Lyons, T. (2018). The three-part recipe for cleaning up your news feed. Meta. https://about.fb.com/news/2018/05/inside-feed-reduce-remove-inform/
Messing, S., DeGregorio, C., Hillenbrand, B., King, G., Mahanti, S., Mukerjee, Z., Nayak, C., Persily, N., State, B., & Wilkins, A. (2021). Facebook privacy-protected full URLs data set (V9) [data set]. Harvard Dataverse. https://doi.org/10.7910/DVN/TDOAPG
Meta. (n.d.). About fact-checking on Facebook. https://www.facebook.com/business/help/2593586717571940
Rosen, G. (2021). How we’re tackling misinformation across our apps. Meta Newsroom. https://web.archive.org/web/20220523080952/https://about.fb.com/news/2021/03/how-were-tackling-misinformation-across-our-apps/
Saltz, E., Barari, S., Leibowicz, C. R., & Wardle, C. (2021). Misinformation interventions are common, divisive, and poorly understood. Harvard Kennedy School (HKS) Misinformation Review, 2(5). https://doi.org/10.37016/mr-2020-81
Sanderson, Z., Brown, M. A., Bonneau, R., Nagler, J., & Tucker J. T. (2021). Twitter flagged Donald Trump’s tweets with election misinformation: They continued to spread both on and off the platform. Harvard Kennedy School (HKS) Misinformation Review, 2(4). https://doi.org/10.37016/mr-2020-77
Solon, O. (2020). Sensitive to claims of bias, Facebook relaxed misinformation rules for conservative pages. NBC News. https://www.nbcnews.com/tech/tech-news/sensitive-claims-bias-facebook-relaxed-misinformation-rules-conservative-pages-n1236182
Théro, H., & Vincent, E. M. (2022). Investigating Facebook’s interventions against accounts that repeatedly share misinformation. Information Processing & Management, 59(2), 102804. https://doi.org/10.1016/j.ipm.2021.102804
Wilcoxon, F. (1945). Individual comparisons by ranking methods. Biometrics Bulletin, 1(6). http://dx.doi.org/10.2307/3001968
Yadav, K., Erdoğdu, U., Siwakoti, S., Shapiro, J. N. & Wanless A. (2021). Countries have more than 100 laws on the books to combat misinformation. How well do they work? Bulletin of the Atomic Scientists, 77(3). https://doi.org/10.1080/00963402.2021.1912111
Funding
This research was supported by the “Make Our Planet Great Again” French state aid managed by the Agence Nationale de la Recherche under the ’Investissements d’avenir’ program with the reference ANR-19-MPGA-0005.
Competing Interests
We have no conflicts of interest to disclose. However, we wish to clarify that the first author is the head of the fact-checking organization Science Feedback that provided access to data on URLs labeled as false on Facebook. Facebook is a customer of Science Feedback.
Ethics
The data collection and processing complied with the EU General Data Protection Regulation (GDPR).
Copyright
This is an open access article distributed under the terms of the Creative Commons Attribution License, which permits unrestricted use, distribution, and reproduction in any medium, provided that the original author and source are properly credited.
Data Availability
All materials needed to replicate this study are available via the Harvard Dataverse: https://doi.org/10.7910/DVN/D3V71G.
The shared CSV files correspond to the raw data that can be used to reproduce the figures. Please note that to fully reproduce our results, you will need to use the list of collected websites and groups shared in the CSVs as a starting point and to access the CrowdTangle and the BuzzSumo APIs to re-run the data collection. Given Facebook’s data sharing policy and the GDPR, we believe this is the most ethical and legal way to facilitate future replication.
The script to collect the data and create all the figures, can be found at the following Github repository: https://github.com/medialab/webclim_hks_misinformation_review_2022.
Acknowledgements
We are very grateful to Social Science One and to Facebook for their partnership in making the Condor Facebook URL Shares dataset available to researchers including ourselves. We thank two anonymous reviewers for their insights on the manuscript. We also thank Guillaume Plique, Benjamin Ooghe-Tabanou and all the médialab technical team for their help with data collection.