Peer Reviewed
Less reliable media drive interest in anti-vaccine information
Article Metrics
1
CrossRef Citations
PDF Downloads
Page Views
As progress on vaccine rollout in the United States slowed down in Spring 2021, it became clear that anti-vaccine information posed a public health threat. Using text data from 5,613 distinct COVID misinformation stories and 70 anti-vaccination Facebook groups, we tracked highly salient keywords regarding anti-vaccine discourse across Twitter, thousands of news websites, and the Google and Bing search engines from May through June 2021, a key period when progress on vaccinations very clearly stalled. Granger causality tests showed that searches for anti-vaccination terms on Google as well as the appearance of these terms on Twitter followed spikes in their appearance in less reliable media sites, but not discussion in the mainstream press.

Research Questions
- Does news coverage influence users to seek out misinformation and post about it on social media, or does media coverage reflect citizens’ interests?
- Do discussions on social media influence the media to report on and users to search for misinformation terms, or does activity on social media reflect information users have gathered?
Essay Summary
- We used vector auto-regression (VAR) models and Granger causality tests on time series data to see if mentions of anti-vaccine information terms on social media and news media of varying levels of credibility predict user interest as measured in search activity on Google and Bing search engines, or whether Granger causality runs in the other direction.
- Spikes in the occurrence of anti-vaccine-related keywords (see Table 4) on unreliable media predict search on Google while the occurrence of such terms in low-reliability media sites predict the usage of these terms on the Twitter platform.
- Social media mentions of the same keywords do not predict search on either Bing or Google search engines and vice versa.
Implications
Understanding the flow of misinformation between different kinds of media is a major research challenge, and the nature of that flow has clear implications for public policy. Given the proliferation of social media and online accessibility to media outlets that distribute news, “the problem of misinformation is less related to scientific quality and rigor, and rather more related to the narrative disputes that occur in the public sphere through digital communication” (Machado et al., 2020).1This article was produced using the International Fact-Checking Network’s database, the largest database on COVID fact-checks available. It combines the fact-checks produced by the CoronaVirusFacts/DatosCoronaVirus alliance, produced by agencies in over 70 countries. Brennen et al. (2020) suggest that digital misinformation originates from both top-down sources (e.g., politicians and celebrities, and bottom-up sources (e.g., the average citizen). Turning to the dynamics of the spread of COVID misinformation, Papakyriakopoulos et al. (2020) find that misinformation from mainstream information sources spread to a higher number of users, although alternative and fringe outlets were found to produce a larger volume of misinformation stories.
Anti-vaccine campaigns offer a relatively tractable topic for understanding such flows. Anti-vaccine discourse on social media has been well-studied. Broniatowski et al. (2018) found that bots, Russian trolls, and content polluters tweet about vaccination at higher rates than the average user and amplify the vaccine debate. In the context of COVID, Sufi et al. (2022) report that anti-vax-related tweets with the keyword “hoax” were found to have the highest level of social impact, with 38,849 retweets, and the highest level of negativity, with a sentiment score of 0.87. By one calculation, social media accounts held by so-called anti-vaxxers increased their following by at least 7.8 million from 2019 to 2020, 1 million people follow anti-vaccine groups on Facebook, and 17 million people subscribe to similar accounts on YouTube (Burki, 2020). Social media companies such as YouTube took actions to remove anti-vaccine content, though some work found that only a small portion of anti-vaccine videos were being removed (Locatelli et al., 2022).
While the literature identifies the possibility that both traditional and social media can play a role in the spread of anti-vaccine information, it leaves a fair amount of uncertainty about their relative weight in the process. To better understand the flow of anti-vaccine information between and across different kinds of media, we introduced two innovations. First, we studied search traffic on anti-vaccine terms as a key outcome. Second, we tested whether changes in the number of mentions of anti-vaccine keywords on one medium (e.g., Twitter) predict changes on others (e.g., Google search). This approach enabled us to provide evidence on whether news coverage influences users to seek out anti-vaccine information and post about it on social media, or if media coverage and social media discussion reflect citizens’ interests in a topic.
Of course, not all media are equal. Some sources prize accuracy and follow strong reporting standards, and others do not. To deepen our analysis of how information flows across different aspects of the information ecosystem, we divided media into different reliability categories using data from NewsGuard, which assesses media sites on multiple dimensions, including the following criteria:2We did not use the NewsGuard criteria regarding financial responsibility, which include whether a website discloses ownership and financing; clearly labels advertising; reveals who’s in charge, including possible conflicts of interest; and provides the names of content creators, along with either contact or biographical info.
- does not repeatedly publish false content
- gathers and presents information responsibly
- regularly corrects or clarifies errors
- handles the difference between news and opinion responsibly
- avoids deceptive headlines
We found that searches for anti-vaccination terms on Google, as well as the appearance of these terms on Twitter, follow spikes in their appearance in media sites that fail many of these criteria. These results speak to the importance of low-quality news media in driving attention to misinformation and the need for interventions targeting small-scale websites.
One limitation of our analysis is that running a keywords-based search to spot anti-vaccine terms does not distinguish articles debunking a specific claim from those promoting it. Therefore, this analysis is best understood as measuring the attention paid to anti-vaccination terms and not necessarily the promotion of anti-vaccine claims. In the future, the analysis could be improved by using word embeddings, sentiment analysis, and other machine learning techniques that can detect the context of sentences to infer if the posts are promoting or debunking misinformation as opposed to being conversations containing misinformation terms. This could potentially disentangle whether search activity is influenced by conversations promoting misinformation or those debunking it. Also, the time series analysis using the VAR models can be expanded by time period and by adding data from more misinformation terms as the misinformation space is constantly evolving, especially with the emergence of communities that oppose vaccines for COVID.
Findings
Finding 1: Unreliable media influence search behavior.
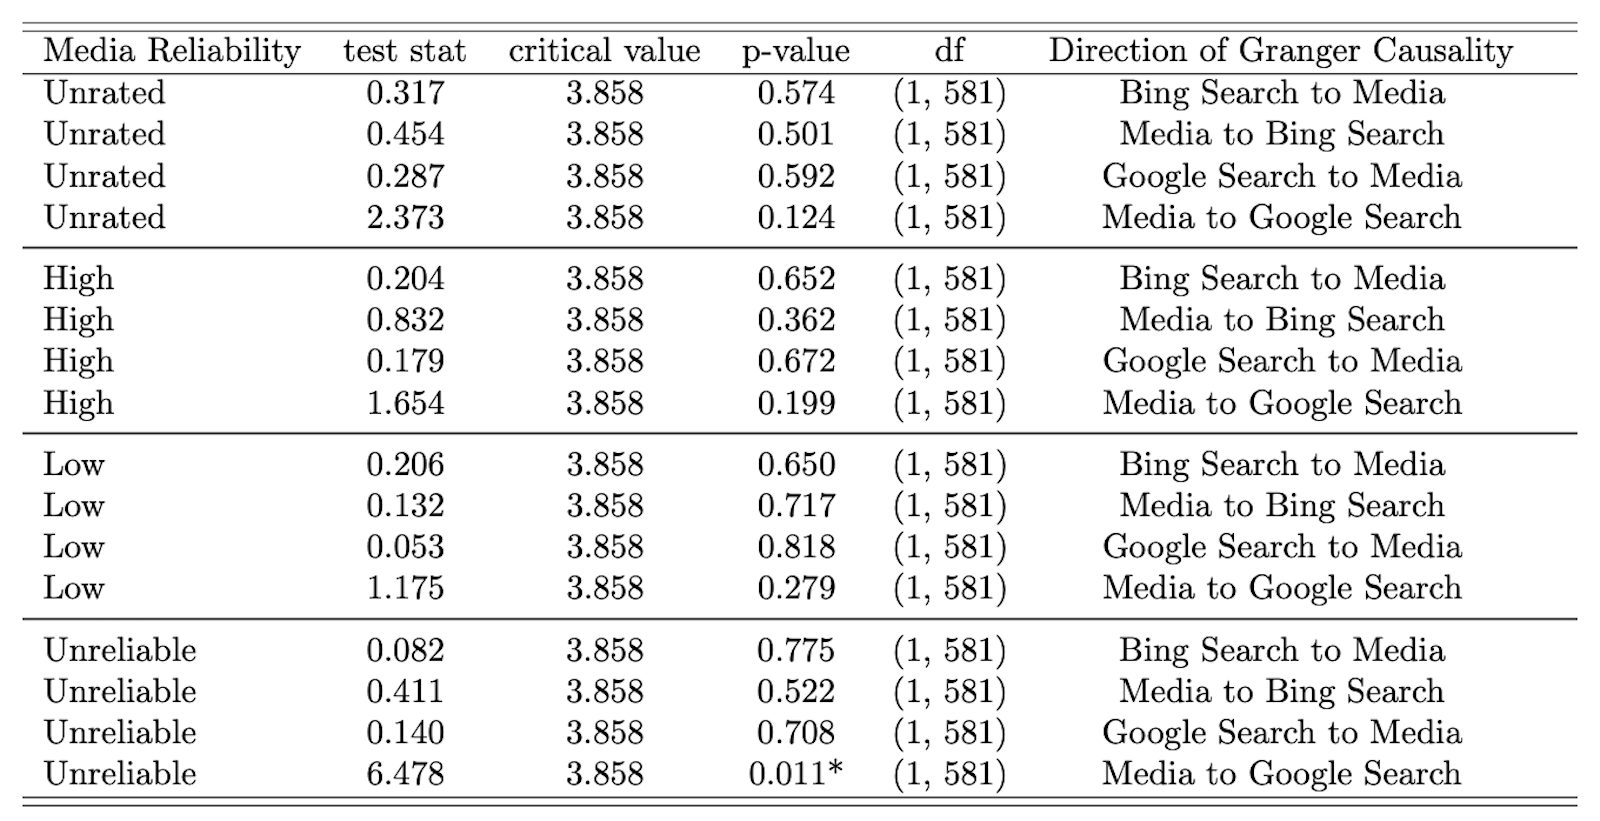
Mentions of anti-vaccine keywords in the media appear to influence search activity on the Google search engine. Specifically, the rate of mentions of anti-vaccine keywords on a given day on unreliable sites predicts the volume of search on those terms in Google. As seen in the impulse response analysis (see Appendix A, Table A2), the magnitude of these effects is modest but in the expected direction (more coverage leads to more search).
Finding 2: Low-rated media influence social media conversation.
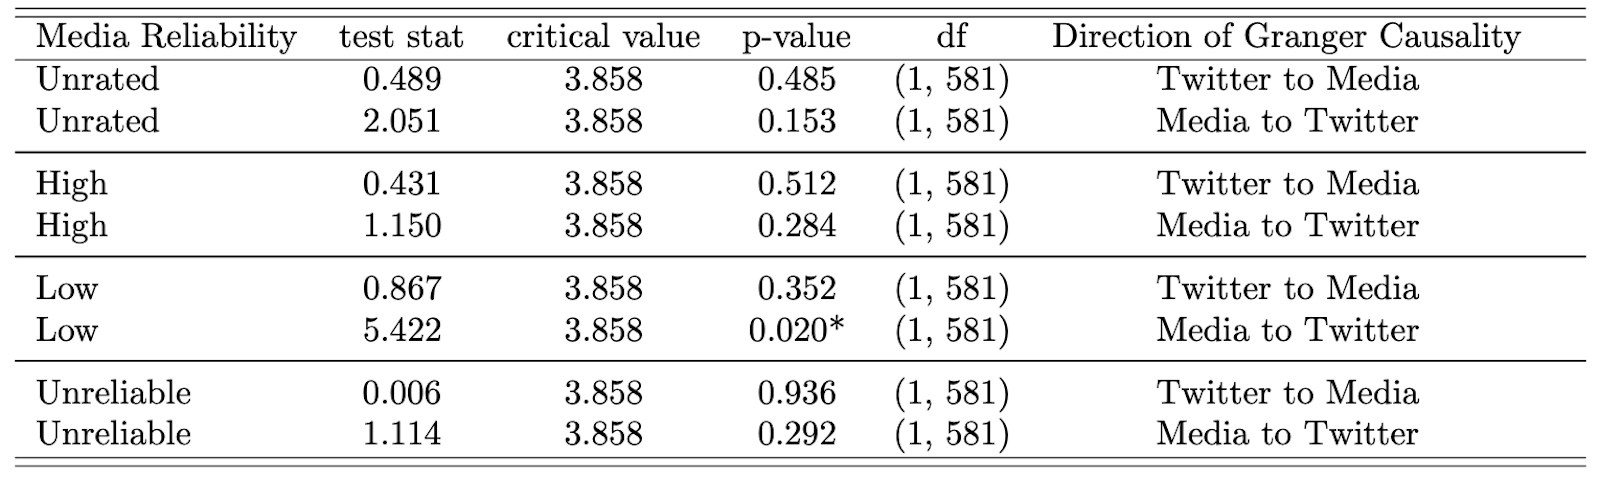
We found evidence that the occurrence of anti-vaccine terms on low-rated media helps predict its occurrence on social media (i.e., on the Twitter platform), as we see in Table 2. On the other hand, Granger causality tests for the influence of Twitter mentions of anti-vaccine keywords on the media were insignificant for all media categories.
Finding 3: Social media patterns do not help predict search.
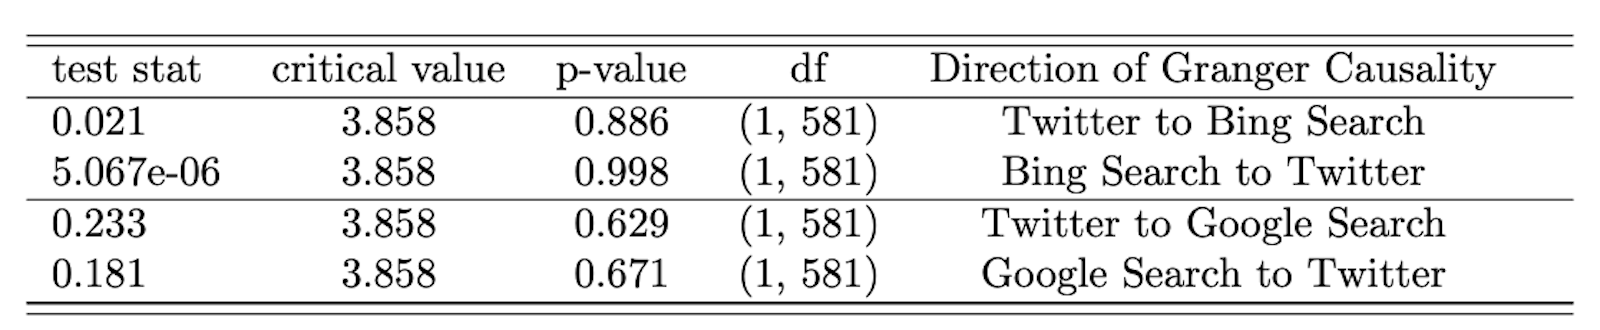
We found no evidence that attention to anti-vaccine narratives on Twitter drove search activity or vice versa, as we see in Table 3. Granger causality tests for the influence of Twitter mentions of anti-vaccine keywords on search were insignificant for both Google and Bing and vice versa.
Methods
Our key question is whether changes in attention to anti-vaccine keywords on one medium (e.g., Twitter or Google search engine) predict changes on others. To answer this question, we used vector auto-regression (VAR), a forecasting algorithm used when two or more time series influence each other (Lütkepohl, 2005). In the VAR model, each variable is modeled as a linear combination of past values of itself and the past values of other variables in the system. In our settings, there are multiple time series that can influence each other—that is, if social media influences search, then the more misinformation terms show up in social media on a given day, the more we would expect them to show up in search in subsequent days—which is modeled as a system of time series equations with one equation per variable. The data for this analysis was collected in real time for Bing and between November and September 2021 for all other sources. This section describes our method in more detail.3For more information on the VAR model used in this research, please see https://www.statsmodels.org/dev/vector_ar.html and https://link.springer.com/book/10.1007/978-3-540-27752-1.
Data
Media ratings. Data were collected on coverage of anti-vaccination keywords in the media from all documents in Bing News containing either the terms “coronavirus” or “COVID.” Documents were counted if they had one or more occurrences of the terms listed in Table 4. We categorized documents by the combination of the five NewsGuard criteria, which received the highest weight in their aggregate score.4These are (1) does not repeatedly publish false content (22 points); (2) gathers and presents information responsibly (18 points); (3) regularly corrects or clarifies errors (12.5 points); (4) handles the difference between news and opinion responsibly (12.5 points); and avoids deceptive headlines (10 points). See https://www.newsguardtech.com/ratings/rating-process-criteria/ for details on the coding of each criteria. Our news media data are a count of the total number of articles collected from Bing News on each date for each criteria combination.5Bing News assigns a publication date based on parsed content. If Bing News is unable to determine a publication date based on parsed content then it uses the crawl date as the publication date. This data was then normalized by dividing the numerator by the number of total documents (media coverage stories about COVID) per day for periods covering May to July 2021.
We broke media into five categories of source quality based on NewsGuard ratings:6The NewsGuard data with ratings and examples of websites in each category are provided by Microsoft Research.
- “High” reliability sources are those which meet all three of NewsGuard’s most important criteria: they do not repeatedly publish false information; they gather and present information responsibly; and then regularly correct or clarify errors. Examples include themonitor.com and startribune.com.
- “Medium” quality sources are those which do not repeatedly publish false information but fail to gather and present information responsibly or do not correct errors. Examples include greenrushdaily.com andfoxnewsinsider.com.
- “Low” reliability sources do not repeatedly publish false information, but do not report information responsibly or correct errors. Examples include pluralist.com and breitbart.com.
- “Unreliable” sources are those which repeatedly publish false information. Examples include thepuristonline.com and vaccinewars.co.
- “Unrated” sources are those which were not sufficiently prominent to be rated by NewsGuard as of July 2021. Because NewsGuard prioritizes sites for rating based on traffic, the unrated category includes a range of low-traffic fringe websites such as dailysquat.com and patriots.win.7Several of these unrated sites have since been rated.
| ‘plandemic’, ‘anti vax’, ‘anti vaxx’, ‘vaccine passports resist’, ‘vaccine passports reject’, ‘vaccine passports refuse’, ‘vaccine reject’, ‘vaccine against’, ‘vaccine hoax’, ‘vaccine implant’, ‘vaccine microchip’, ‘vaccine abolition’, ‘vaccine lie’, ‘vaccine conspiracy’, ‘vaccine no’, ‘vaccine injury’, ‘vaccine death’, ‘vaccine refuse’ ,’vaccine complaint’, ‘vaccine hesitant’, ‘vaccine hesitancy’, ‘vaccine resist’, ‘vaccine infertility’, ‘vaccine altering genetics’, ‘vaccination reject’, ‘vaccination against’, ‘vaccination hoax’,’vaccination implant’, ‘vaccination microchip’, ‘vaccination abolition’, ‘vaccination lie’,’vaccination conspiracy’,’vaccination no’, ‘vaccination injury’, ‘vaccination death’, ‘vaccination refuse’, ‘vaccination complaint’, ‘vaccination hesistant’, ‘vaccination hesitancy’, ‘vaccination resist’,’vaccination infertility’, ‘vaccination altering genetics’,’vaxx implant’, ‘vaxx microchip’, ‘vaxx abolition’, ‘vaxx lie’,’vaxx conspiracy’,’vaxx no’, ‘vaxx injury’, ‘vaxx death’, ‘vaxx refuse’, ‘vaxx complaint’, ‘vaxx hesistant’, ‘vaxx hesitancy’, ‘vaxx resist’,’vaxx infertility’, ‘vaxx altering genetics’ |
| Note: We selected these keywords based on input from 30 research assistants who have analyzed CrowdTangle data from 70 anti-vaccination Facebook groups and over 5,600 coronavirus-related misinformation narratives from over 80 countries since March 2020.8For more information, see here: https://esoc.princeton.edu/publications/esoc-covid-19-misinformation-dataset |
Search. We collected information regarding daily search activity on both Bing and Google for the time period from May to July 2021. The search engines tap different markets. Google has a market share of 95.47 percent in India and accounted for the majority of the global search engine market, ahead of other competitors such as Bing, Yandex, and Baidu. Bing is quite popular in the UK (with a 23%–25% market share) and Taiwan (a 24%–26% market share) and provides the index behind several prominent search interfaces, including Yahoo.
The Bing search data were generated from Bing’s COVID queries data, which includes queries Microsoft believes to be related to COVID.9For further documentation, see here: https://github.com/microsoft/BingCoronavirusQuerySet The Bing queries dataset was curated from the Bing search logs over the period of Jan 1st, 2020 – July 2021. It involves desktop users only. Only searches that were issued many times by multiple users were included. The dataset includes queries from all over the world that had an intent related to the Coronavirus or COVID. In some cases, the intent is explicit in the query itself (e.g., “Coronavirus updates Seattle”), while in other cases, it is implicit (e.g., “Shelter in place”). The implicit intent of search queries (e.g., “Toilet paper”) was extracted using random walks on the click graph as outlined in the paper “Random Walks on the Click Graph” by researchers at Microsoft (Craswell & Szummer, 2007). All personally identifiable data were removed“ (Microsoft, 2020).
The Bing data we used for our analysis is publicly available in a lower-resolution form via GitHub; however, in order to get a better signal, we have used a higher resolution of this same data provided by the Microsoft Research team, which is not available publicly. We searched for anti-vaccine terms within the Bing queries and generated a daily level time series that reflects the search for these terms on the Bing search engine.
The Google Trends data count queries of terms on the Google search engine normalized from 0 to 100, where a higher value means the terms account for a higher proportion of all queries on a given day, not a higher absolute query count.10A tiny country where 80% of the queries are for ”5g” will get twice the score of a giant country where only 40% of the queries are for ”5g” (Google). In this paper, worldwide data is used—the data is not filtered by geography. The raw Google Trends data is rounded to integer precision, which can cause problems as “all-zero time series may be returned for unpopular queries when requested together with more popular queries” (West, 2020, p. 1). Therefore, Google Trends Anchor Bank (G-TAB) was used, which ensures that each search query is calibrated by performing an efficient binary search within the anchor bank.11For further documentation on Google Trends Anchor Bank, see https://github.com/epfl-dlab/GoogleTrendsAnchorBank As Twitter is primarily a Western platform, the keywords used were in English, and NewsGuard is Western-biased as well, we made the restriction of Google queries to focus only on the United States. This ensured better comparability within the different sources of data in the time series model.12We did not find similar results when we used Google queries at the global level. The Google data is non-stationary at the global level, and so we took the first difference of this variable before performing VAR analysis. The results of the analysis using Google data at the global scale are in the Appendix.
Model fitting
After merging all the daily level time series data on the selected anti-vaccine keywords from social media, search engines, and traditional media, we fit the VAR model and ran Granger causality tests, which assess whether including a given variable as a predictor adds explanatory power over and above predictions based on all other variables. These methods are commonly used to assess if one variable can help predict the other. In this case, we interpret predictive capability as evidence of the flow of anti-vaccine information between social media vs. formal media vs. users’ search behavior on search engines.
ADF tests for stationarity. In order to run a VAR analysis, all variables need to be stationary. Time series variables are stationary if they do not have a trend or seasonal effects. Summary statistics such as the mean or variance calculated on the time series are consistent over time when a time series is stationary, which makes it easier to model. We used Augmented Dickey-Fuller tests for stationarity on each of the time series variables.
In the test, we found that one of the variables in the time series data is non-stationary. The academic literature on VAR models suggests that “multivariate VAR models estimated with non-stationary data raise difficult econometric questions because differencing to achieve stationary can introduce distortions into multivariate models” (Fanchon & Wendel, 1992). Therefore, we removed the non-stationary variable, mentions of anti-vaccine keywords in mid-rated media, before carrying out the VAR model analysis. This ensured the stability of the results as the time series data were all stationary.
Testing for autocorrelation. Using the “autocorrelation” function, we can measure the linear relationship between an observation at time t and the observations at previous times, which helps assess whether the data are stationary. Stationary data show a constant long-term mean and have a constant variance, while a non-stationary process has a variable variance and mean. As seen in Appendix A, Figure A1, the ACF drops to a statistically insignificant level almost immediately for our data, which is consistent with stationarity (the ACF of non-stationary data decreases slowly).
Selection of lag. A central issue in VAR analysis is selecting the number of lags. Standard practice is to use traditional information criteria like the Akaike Information Criterion (AIC), Bayesian Information Criterion (BIC), or Hannan-Quinn criterion (HQ) to select the appropriate lag length for the VAR model. In this analysis, we have used the AIC.
Granger causality tests. Granger causality is one of the methods to investigate causality between two variables in a time series. The basic idea is that if the value of one variable x at an earlier period helps predict the value of another variable y over-and-above the prediction made simply with prior values of y, then x can be said to cause y. The standard Granger causality test checks the statistical significance of the increase in the ability to predict a given variable by accounting for the other variable.
Impulse Response Function (IRF). The IRF can be defined as the reaction of a system in response to an external change. It allows us to trace the transmission of a single shock within a system of equations, a feature that makes it useful to evaluate the magnitude of impact. We used the orthogonalized IRF as we assumed shocks to different variables were uncorrelated; that is, we isolated the impact of a shock to one variable (see Appendix A, Figure A2).
A limitation of our study method is that keyword-based matching is noisy. We addressed this issue in an earlier paper published by the HKS Misinformation Review, where we manually reviewed a random sample of 500 tweets from our full dataset captured using the same Twitter research API (Siwakoti et al., 2021). For the sample containing COVID terms, the true positive rate was 100% (i.e., all COVID-labeled tweets were accurately categorized as being about COVID). However, 20% of the data in the sample of non-COVID tweets were mislabeled as being not about COVID when they, in fact, were (i.e., the false-negative rate was 20%). While our methodology may underestimate the number of tweets containing a COVID anti-vaccine term, we have confidence that it captures a significant amount of the relevant conversation. Other researchers have taken a keywords-based approach to using the Twitter API to study misinformation while acknowledging that measuring misinformation is difficult due to its diverse and dynamic nature of content (Green et al., 2021; Tsao et al., 2021). Our method for choosing anti-vaccine keywords is similar with other academic research in the misinformation space where researchers have manually chosen keywords using snowball sampling (DeVerna et al., 2021; Muric et al., 2021).
Conclusion and suggestions for future research
Our work highlights the possibility that less reliable media can play an important role in driving attention to misinformation narratives. In our case, spikes in attention to anti-vaccination keywords in less reliable media drove interest in those terms on the largest search engine in the United States. We see a similar relationship between unreliable media and social media—spikes in the occurrence of anti-vaccine terms in unreliable media helps predict spikes in the occurrence of these terms on social media (Twitter). These results suggest that policymakers and stakeholders trying to understand how misinformation flows across platforms should focus on less reliable media sites.
The analysis in this paper does not differentiate efforts to promote anti-vaccine information from those seeking to counter such information. Future research could focus more on distinguishing these two kinds of content using text data.
According to Starbid and Willson (2020), “understanding of disinformation requires accounting for the spread of content across platforms…” (p. 1). As Watts et al. (2021) and Green et al. (2023) discuss at length, much greater attention is needed to the information ecosystem as a whole to understand the role of various media sources in driving the current epistemological challenges facing society. Studying the movement of interest in key topics across elements of the media ecosystem provides one way to advance such work.
Topics
Bibliography
Broniatowski, D. A., Jamison, A. M., Qi, S., AlKulaib, L., Chen, T., Benton, A., Quinn, S. C., & Dredze, M. (2018). Weaponized health communication: Twitter bots and Russian trolls amplify the vaccine debate. American Journal of Public Health, 108(10), 1378–1384. https://doi.org/10.2105/AJPH.2018.304567
Burki, T. (2020). The online anti-vaccine movement in the age of COVID-19. The Lancet Digital Health, 2(10), e504–e505. https://doi.org/10.1016/S2589-7500(20)30227-2
Chen, E., Lerman, K., & Ferrara, E. (2020). Tracking social media discourse about the COVID-19 pandemic: Development of a public coronavirus Twitter data set. JMIR Public Health and Surveillance, 6(2), e19273. https://doi.org/10.2196/19273
Craswell, N., & Szummer, M. (2007). Random walks on the click graph. In SIGIR ’07: Proceedings of the 30th annual international ACM SIGIR conference on research and development in information retrieval (pp. 239–246). Association for Computing Machinery. https://doi.org/10.1145/1277741.1277784
DeVerna, M. R., Pierri, F., Truong, B. T., Bollenbacher, J., Axelrod, D., Loynes, N., Torres-Lugo, C., Yang, K.-C., Menczer, F., & Bryden, J. (2021). CoVaxxy: A collection of English-language Twitter posts about COVID-19 vaccines. arXiv. https://doi.org/10.48550/arXiv.2101.07694
Fanchon, P., & Wendel, J. (1992). Estimating VAR models under non-stationarity and cointegration: Alternative approaches for forecasting cattle prices. Applied Economics, 24(2), 207–217. https://doi.org/10.1080/00036849200000119
Green, A., Gully, A., Roth, Y., Roy, A., Tucker, J. A., & Wanless, A. (2023). Evidence-based misinformation interventions: Challenges and opportunities for measurement and collaboration. Carnegie Endowment for International Peace. https://carnegieendowment.org/2023/01/09/evidence-based-misinformation-interventions-challenges-and-opportunities-for-measurement-and-collaboration-pub-88661
Green, M., Musi, E., Rowe, F., Charles, D., Pollock, F. D., Kypridemos, C., Morse, A., Rossini, P., Tulloch, J., Davies, A., Dearden, E., Maheswaran, H., Singleton, A., Vivancos, R., & Sheard, S. (2021). Identifying how COVID-19-related misinformation reacts to the announcement of the UK national lockdown: An interrupted time-series study. Big Data & Society, 8(1), 20539517211013868. https://doi.org/10.1177/20539517211013869
Google. Google Trends (n.d.)
Locatelli, M. S., Caetano, J., Meira Jr., W., & Almeida, V. (2022). Characterizing vaccination movements on YouTube in the United States and Brazil. In HT ‘22: Proceedings of the 33rd ACM conference on hypertext and social media (pp. 80–90). Association for Computing Machinery. https://doi.org/10.1145/3511095.3531283
Lütkepohl, H. (2005). New introduction to multiple time series analysis. Springer Science & Business Media.
Microsoft. (2020). Bing coronavirus query set. https://github.com/microsoft/BingCoronavirusQuerySet
Muric, G., Wu, Y., & Ferrara, E. (2021). COVID-19 vaccine hesitancy on social media: Building a public Twitter data set of antivaccine content, vaccine misinformation, and conspiracies. JMIR Public Health and Surveillance, 7(11), e30642. https://doi.org/10.2196/30642
Papakyriakopoulos, O., Medina Serrano, J. C., & Hegelich, S. (2020). The spread of COVID-19 conspiracy theories on social media and the effect of content moderation. Harvard Kennedy School (HKS) Misinformation Review, 1(3). https://doi.org/10.37016/mr-2020-034
Pfeffer, J., Mooseder, A., Lasser, J., Hammer, L., Stritzel, O., & Garcia, D. (2023). This sample seems to be good enough! Assessing coverage and temporal reliability of Twitter’s academic API. arXiv. https://doi.org/10.48550/arXiv.2204.02290
Shapiro, J. N., Siwakoti S., & Oledan J. (2020). ESOC COVID-19 misinformation dataset [Data set]. Empirical Studies of Conflict Project, Princeton University. https://esoc.princeton.edu/publications/esoc-covid-19-misinformation-dataset
Siwakoti, S., Yadav, K., Bariletto, N., Zanotti, L., Erdoğdu, U., & Shapiro, J. N. (2021). How COVID drove the evolution of fact-checking. Harvard Kennedy School (HKS) Misinformation Review, 2(3). https://doi.org/10.37016/mr-2020-69
Starbird, K., & Wilson, T. (2020). Cross-platform disinformation campaigns: Lessons learned and next steps. Harvard Kennedy School (HKS) Misinformation Review, 1(1). https://doi.org/10.37016/mr-2020-002
Sufi, F. K., Razzak, I. & Khalil, I. (2022). Tracking anti-vax social movement using AI-based social media monitoring. IEEE Transactions on Technology and Society, 3(4), 290–299. https://ieeexplore.ieee.org/document/9834043
Tsao, S.-F., Chen, H., Tisseverasinghe, T., Yang, Y., Li, L., & Butt, Z. A. (2021). What social media told us in the time of COVID-19: A scoping review. The Lancet Digital Health, 3(3), e175–e194. https://doi.org/10.1016/S2589-7500(20)30315-0
Twitter. Twitter research API v2.
Vieira Machado, C. C., Santos, J. G., Santos, N., & Bandeira, L. (2020). Scientific [self] isolation. International trends in misinformation and the departure from the scientific debate. https://laut.org.br/wp-content/uploads/2020/11/Political-Self-Isolation-vF.pdf
Watts, D., Rothschild, D. M., & Mobius M. (2021). Measuring the news and its impact on democracy. PNAS, 118(15). https://doi.org/10.1073/pnas.1912443118
West, R. (2020). Calibration of Google Trends time series. In CIKM ’20: Proceedings of the 29th ACM international conference on information & knowledge management (pp. 2257–2260). Association for Computing Machinery. https://doi.org/10.1145/3340531.3412075
Funding
This research was funded by a gift from Microsoft to Princeton University.
Competing Interests
The author(s) declared no potential conflicts of interest with respect to the research, authorship, and/or publication of this article.
Ethics
The data for the project was obtained from publicly available sources and via approved access to Twitter’s academic research API and the CrowdTangle API.
Copyright
This is an open access article distributed under the terms of the Creative Commons Attribution License, which permits unrestricted use, distribution, and reproduction in any medium, provided that the original author and source are properly credited.
Data Availability
All materials needed to replicate this study are available via the Harvard Dataverse: https://doi.org/10.7910/DVN/LOIZTS
The data is in a processed daily time series format and not in the rawest version. This is because the version of Bing data we use is proprietary data provided by Microsoft Research and the Twitter data in the form of raw tweets cannot be shared as per Twitter’s policies. We provide the tweet ids for the data used in this analysis.
Acknowledgements
This work was supported by Microsoft. We thank Meredith Berger, Derek Worthen, and Alexander Wirth for continued support throughout the project as well as Professor Tamar Mitts at Columbia University for invaluable feedback.