Peer Reviewed
Declining information quality under new platform governance
Article Metrics
0
CrossRef Citations
PDF Downloads
Page Views
Following the leadership transition on October 27, 2022, Twitter/X underwent a notable change in platform governance. This study investigates how these changes influenced information quality for registered U.S. voters and the platform more broadly. We address this question by analyzing two complementary datasets—a Twitter panel and a Decahose sample. Our findings reveal a subtle yet statistically significant decline in information quality across both datasets, stemming from an increase in content from low-quality sources and a decrease in content from high-quality sources. These results suggest that the ownership change and subsequent policy adjustments were associated with shifts in the platform’s information ecosystem. Our results underscore the broader significance of ownership and governance for information quality in dynamic sociotechnical systems, highlighting the determinantal power that platform owners may have in shaping the information ecosystem.

Research Questions
- How has the overall information quality changed on Twitter/X following the ownership transition?
- How has the market share of low- and high-quality sources changed on the platform overall, and for U.S. voters in particular, surrounding the ownership change of Twitter/X on October 27, 2022?
Essay Summary
- This study investigates changes in information quality on Twitter/X in the period before and after the ownership transition on October 27, 2022, drawing on two datasets: the Twitter panel (representative sample of U.S. voters) and the Decahose sample (a global 10% random sample).
- We applied NewsGuard reliability scores, which assess the trustworthiness of online news and information sources, to the domains linked in URLs shared by users in our dataset. This allowed us to analyze the quality of information circulating on the platform before and after the acquisition.
- Analysis revealed a post-acquisition decline in information quality across both datasets, marked by an increase in the share of content from low-quality sources and a corresponding decrease in high-quality sources. While low-quality sources continued to account for a relatively small percentage of posts on the platform, their proportion increased relative to the period before Musk took over Twitter.
- The findings emphasize the critical role of ownership and governance in determining information quality in sociotechnical systems.
Implications
On October 27, 2022, Twitter Inc. underwent a significant change in ownership, followed by organizational restructuring (West, 2022). This included the departure of senior executives, large-scale layoffs, and a wave of voluntary resignations (Mac et al., 2022; O’Sullivan & Duffy, 2022). Shortly after, the company revised several content-related policies, such as reinstating previously suspended accounts, discontinuing certain enforcement guidelines, and dissolving advisory groups like the Trust and Safety Council (Duffy & LeBlanc, 2022; O’Brien & Ortutay, 2022; O’Sullivan, 2022; Sherman & Thomas, 2022). The platform also began adjusting how information circulated, slowing some external links while increasing the visibility of individual creators branded as “news influencers” (Merrill & Harwell, 2023). These developments occurred alongside a rise in automated account activity (Hickey et al., 2023) and public discussions about evolving content dynamics and user engagement patterns (Barrie, 2023; Brewster et al., 2022; Frenkel & Conger, 2022). This reorientation also marked a departure from prior moderation strategies aimed at curbing the spread of disputed or unverified information in the wake of major political events (McCabe et al., 2024). The renewed visibility of previously removed accounts coincided with growing concerns about amplified interactions with contentious figures (Barrie, 2023), increased bot-driven activity (Hickey et al., 2023), and heightened levels of harmful content (Brewster et al., 2022; Frenkel & Conger, 2022; McCarthy, 2023).
Past cases, such as Facebook’s 2018 algorithm shift toward “meaningful interactions,” inadvertently amplifying hyperpartisan content (Horwitz & Seetharaman, 2021; Reuning et al., 2022), further illustrate the potential consequences of leadership-driven changes. Designed to prioritize personal content over public posts, this shift unintentionally boosted divisive material, disproportionately increasing engagement for certain political groups (Reuning et al., 2022). Internal reports revealed that, rather than fostering positive interactions, the algorithm intensified an outrage-driven discourse on the platform (Horwitz & Seetharaman, 2021). Around the same time, broader research on platform governance found that engagement-based ranking systems tend to favor emotionally charged content, often reinforcing ideological divides and creating echo chambers. These findings highlight how algorithmic interventions—whether intentional or not—can fundamentally reshape online discourse, often in ways that undermine content diversity and contribute to social fragmentation.
These changes motivate a closer examination of how the platform’s information quality evolved over time. To evaluate changes in information quality, we employed two complementary datasets: the Twitter panel (Hughes et al., 2021) and the Decahose sample. The Twitter panel represents a fixed sample of U.S. voters, allowing for precise tracking of U.S. voter behavior (Grinberg et al., 2019; Hughes et al., 2021; Shugars et al., 2021). The Decahose offers a representative sample of all content shared on the platform and, therefore, provides a complementary prism for the activity of voters on the platform, including that by non-registered voters, non-U.S. individuals, organizations, automated accounts (Chen et al., 2021), and other accounts (Pfeffer et al., 2023). Together, these datasets offer a comprehensive view of shifts in information quality, illustrating how Twitter’s ecosystem evolved following the ownership change.
We operationalized information quality by evaluating the domains that URLs in tweets linked to, using source quality scores provided by NewsGuard (2024). These scores, widely used in the literature (Baribi-Bartov et al., 2024; Dias et al., 2020; McCabe et al., 2024), reflect the overall reliability of a source of information across both datasets. By calculating the average source quality scores of links shared before and after the ownership change, we identified shifts in the quality of information on the platform.
Our findings reveal changes in information quality following the acquisition. Both the Twitter panel and Decahose datasets indicate a decline in the overall quality of content circulating on the platform. While the precise drivers of this decline require further investigation, the consistent pattern across datasets highlights the potential impact of platform-level changes on the information ecosystem. High-quality sources continued to account for approximately 90% of shared content, while low-quality links made up the remaining 10%—a distribution that aligns with prior research showing that high-quality content still dominates engagement, even as low-quality content circulates within smaller, highly active communities (Baribi-Bartov et al., 2024; Budak et al., 2016; Budak et al., 2024; Grinberg et al., 2019). However, the growing market share of low-quality sources signals a shift in the platform’s information environment. While the overall change in information quality is modest, even modest declines in information quality can have a meaningful impact, especially when sustained over time.
Declines in information quality are not only relevant to what content circulates (Guess, Lockett et al., 2020), but also to how people engage with and trust institutions. Exposure to low-quality content has been linked to lower trust in mainstream media and, in some cases, higher trust in government, particularly when individuals’ preferred political party holds power (Ognyanova et al., 2020). As public confidence in the credibility of information weakens, individuals may find it more difficult to navigate the information environment and make informed decisions (Lazer et al., 2018). Beyond political discourse, declining information quality has broader societal ramifications, particularly in areas like public health. The spread of unreliable content on critical issues, such as vaccines and medical treatments, can undermine trust in scientific expertise, shape risk perceptions, and alter individual behavior in ways that carry tangible consequences for public health outcomes (Chou et al., 2020; Guess, Nyhan, et al., 2020). As digital platforms play an increasingly central role in how information is produced, disseminated, and consumed, even subtle shifts in content dynamics can contribute to long-term transformations in public trust, civic engagement, and the resilience of democratic institutions.
The decline in the information quality of content shared may be driven by several underlying mechanisms. One possibility is algorithmic amplification of engagement-driven content, where the platform’s ranking systems prioritize engagement over credibility, favoring sensational or emotionally charged narratives that attract higher interaction (Guess et al., 2023; Vosoughi et al., 2018). Since lower-credibility sources might use these tactics (Grinberg et al., 2019), they may have been disproportionately amplified, encouraging their sharing and leading to a decline in overall information quality. A second mechanism would be shifts in user composition and activity following the ownership transition (McCabe et al., 2024). If users who primarily shared high-credibility content disengaged while those favoring lower-credibility sources remained or became more active, this could have altered the average quality of shared content (Bail, 2021). Another factor could be changes in content moderation and platform policies, which may have influenced what information circulated. If content moderation policies became less stringent or previously banned accounts were reinstated (Barrie, 2023; Hickey et al., 2023), lower-credibility sources may have been shared more, contributing to their increased market share. Similarly, a decline in institutional and high-credibility sources’ activity, such as reduced activity from mainstream media, journalists, and expert communities (Budak et al., 2024), may have led to a lower volume of high-quality information, shifting the balance of shared content.
While our analysis reveals notable shifts in information quality on Twitter/X, the lack of exposure data prevents us from assessing whether users were actually seeing more low-quality content. Understanding exposure effects would require access to user feeds, engagement metrics, or platform-side ranking systems—data that was not available for this study. This constraint is common in research on digital platforms, where shared content is often analyzed as a practical alternative due to the inaccessibility of exposure data. Despite this limitation, sharing behavior remains a meaningful proxy for platform-wide circulation and enables us to identify broader trends in the quality of disseminated information.
Beyond exposure limitations, our study also faced constraints related to data availability and methodological scope. First, our dataset access ended in May 2023 due to X’s policy changes, preventing us from analyzing long-term trends beyond this period. As a result, we cannot determine whether the observed shifts in information quality have persisted, stabilized, or reversed since our analysis. Second, our analysis relies on domain-level information quality scores rather than individual stories (URLs) and assumes a consistent level of credibility across an entire source. However, individual stories can vary significantly in reliability even within the same domain (Green et al., 2024). By aggregating scores at the domain level, our study may overlook important variations in the credibility of shared content. A URL-level approach would provide a more precise measure of how information quality is changing at the level of individual stories.
While shifts in user activity and engagement are important factors influencing the information ecosystem, they fall outside the scope of this study. Our focus is on identifying structural changes in the quality of shared content rather than analyzing individual user behaviors or participation trends. Although examining user engagement, such as whether high-credibility users disengaged or lower-credibility sources became more active, could provide valuable insights, such an analysis would require a different research design centered on user-level behavioral patterns. Instead, our study examines how content is shared and circulated, offering insights into systemic shifts in information quality.
Despite these limitations, our study provides a comprehensive analysis of how information quality on Twitter/X has shifted, revealing significant changes in the composition of shared content. By examining trends in information quality, we have identified a decline in high-quality sources and a growing presence of lower-credibility content, offering valuable insights into the evolving information ecosystem. Future research could incorporate longitudinal data, URL-level credibility assessments, and exposure metrics to better understand how platform dynamics and user behavior interact to shape the information ecosystem.
Findings
Finding 1: The information quality on Twitter/X decreased following the ownership change, in both the Twitter panel and Decahose datasets.
Our analysis revealed a significant decline in the quality of information shared on Twitter/X following the platform’s ownership transition. Before the acquisition, both the Twitter panel and Decahose datasets exhibited slight improvements in information quality before the acquisition on October 27, 2022, but after the transition, this trend reversed, leading to a measurable decline in the credibility of shared sources. This pattern is evident across different measures of credibility and was confirmed by an interrupted time series (ITS) analysis, which detects a sharp decline immediately after the acquisition, followed by a sustained downward trend. These findings suggest that changes in platform governance and user behavior correspond with a deterioration in the quality of shared content. The following sections outline how we assessed information quality, detail the observed trends, and present robustness checks supporting these results. The details about ITS method can be found in the Methods section.
To assess shifts in information quality, we analyzed the links shared in the Twitter panel and Decahose datasets, capturing both original shares and retweets. Each shared URL was matched to its source domain, which we evaluated using NewsGuard reliability scores. These scores measure factual accuracy and adherence to journalistic standards, with higher scores indicating greater reliability. To ensure our analysis focused on news content, we included only domains classified as news by NewsGuard, excluding social media and other platforms without centralized editorial oversight.
We define information quality (IQ) as the average reliability of shared sources, calculated monthly by averaging the NewsGuard scores of all shared news domains in each dataset. NewsGuard assigns scores ranging from 0 to 100, with higher scores reflecting greater credibility (e.g., wsj.com: 100, vox.com: 87.5, nypost.com: 69.5, onegreenplanet.org: 40, infowars.com: 7.5). NewsGuard categorizes these scores into four groups based on adherence to journalistic standards: 1) credible (75–100), indicating strong adherence to journalistic standards; 2) credible with exceptions (60–74), indicating basic compliance with some notable shortcomings; 3) proceed with caution (40–59), indicating significant journalistic failures; and 4) proceed with maximum caution (0–39), indicating very low credibility. Further details on IQ score calculation and NewsGuard methodology are provided in the Methods section.
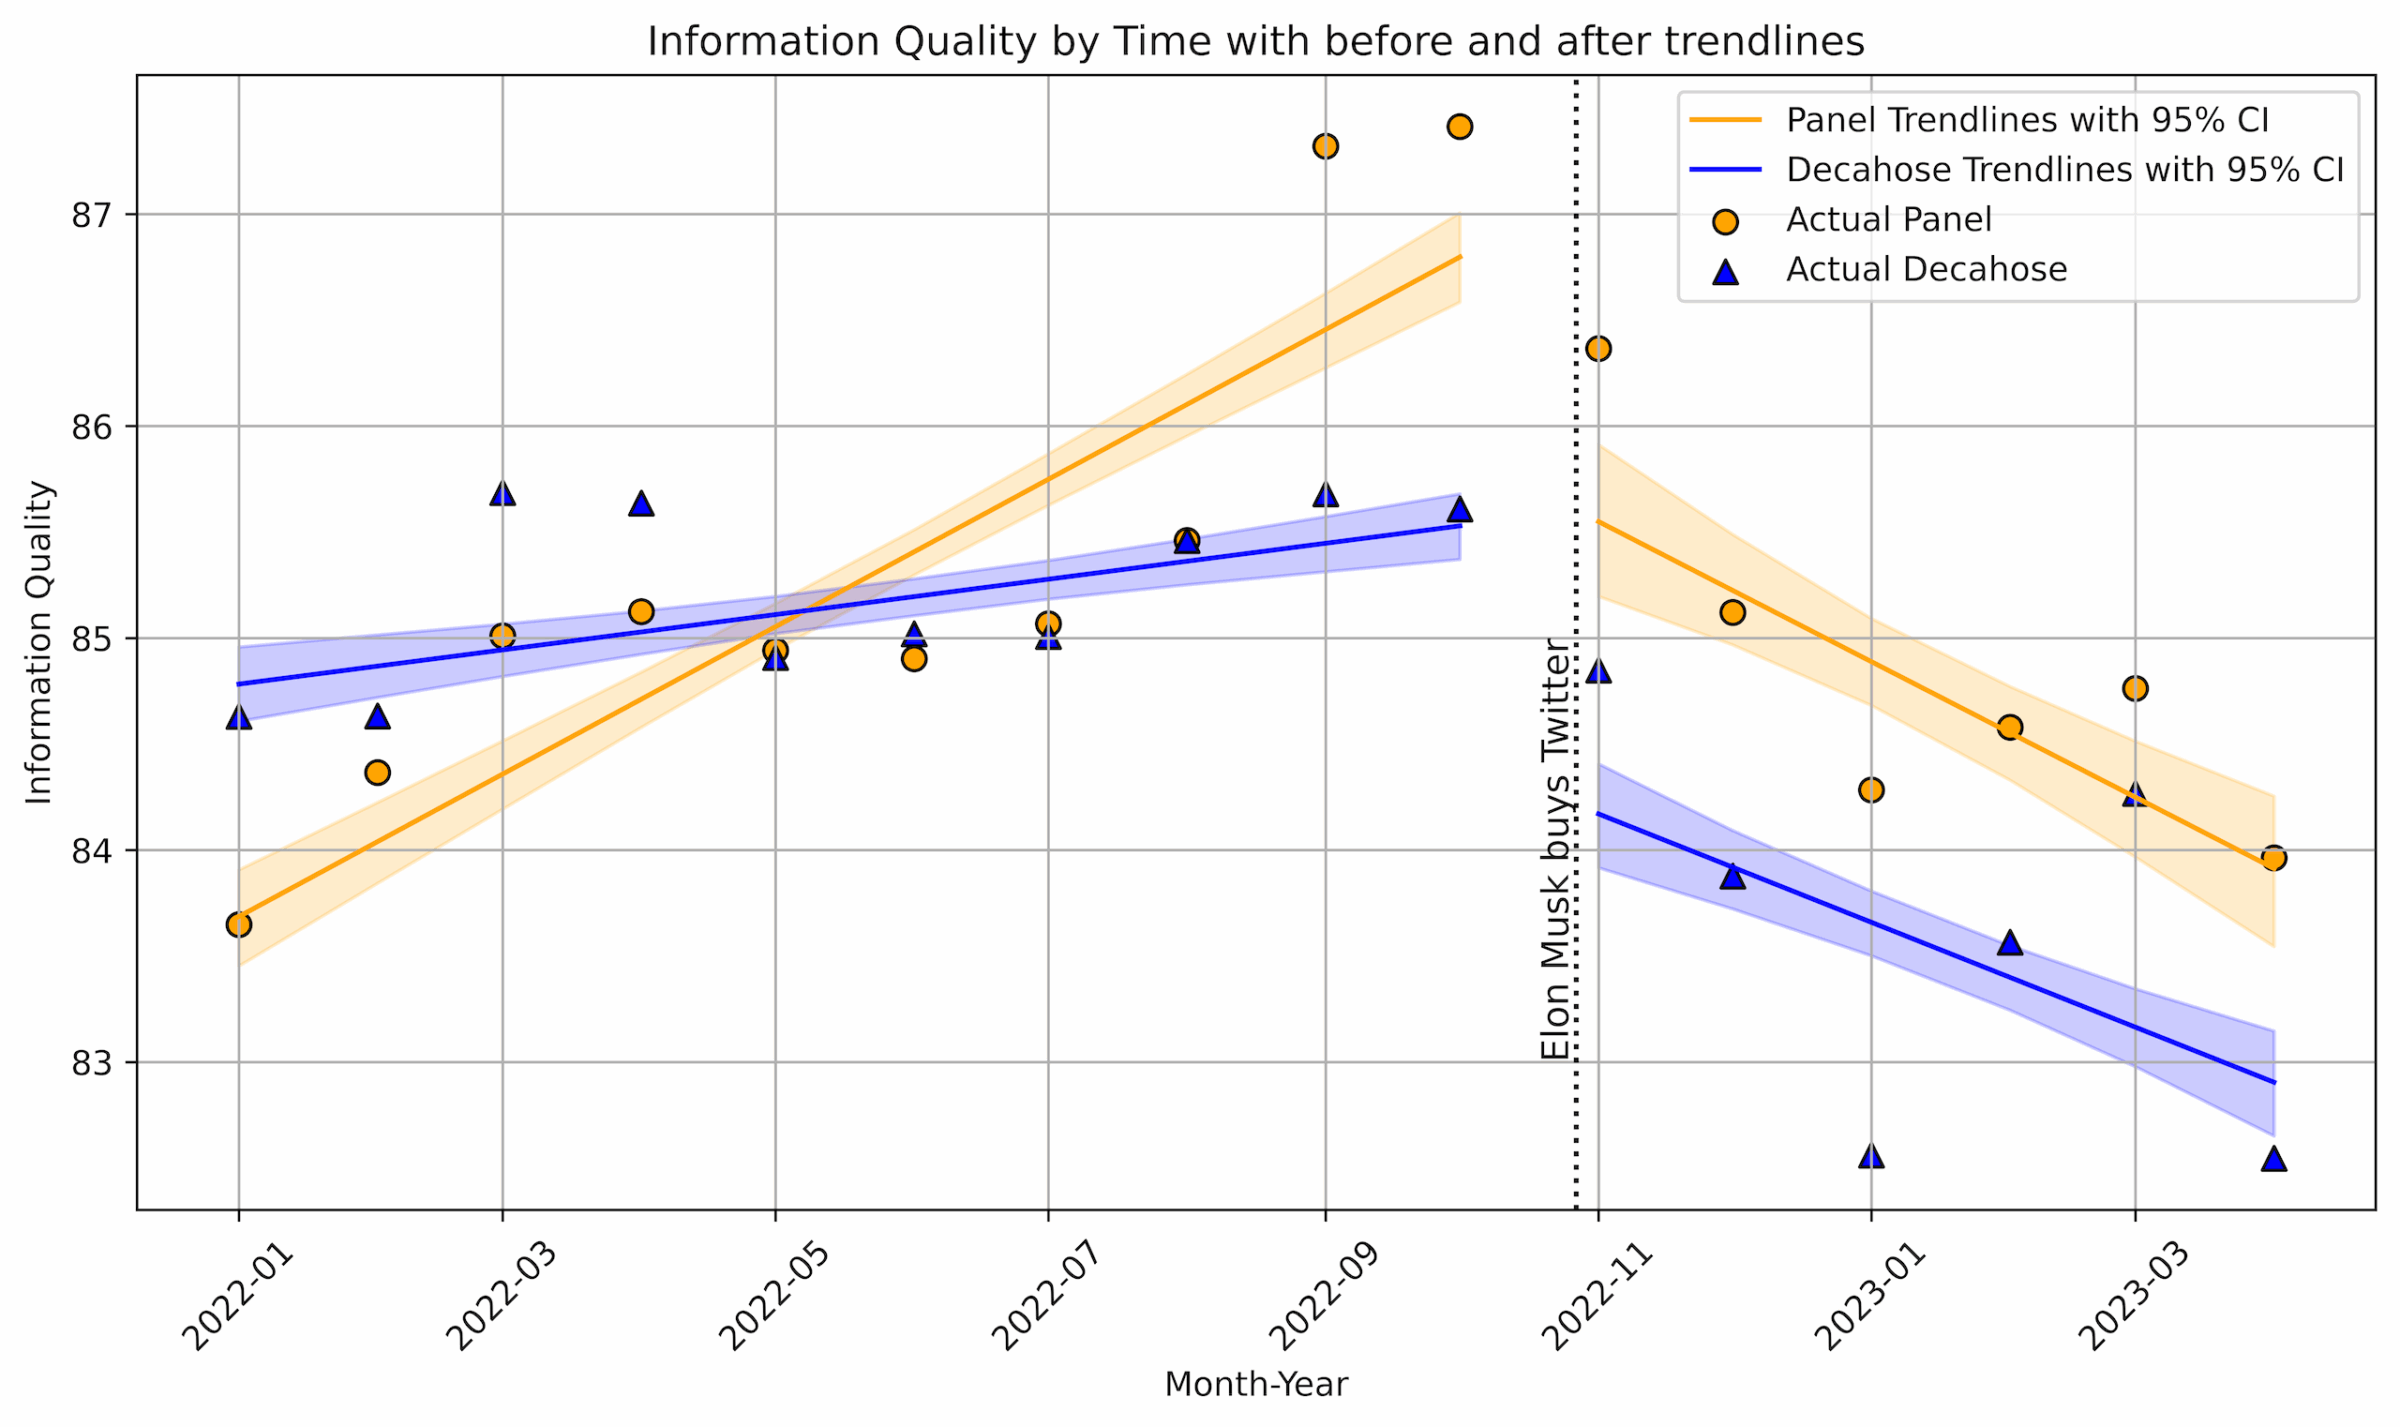
Figure 1 illustrates the monthly average information quality scores for the Twitter panel (orange) and Decahose datasets (blue) from January 2022 to April 2023, with a vertical black dashed line designating Musk’s acquisition of Twitter in October 2022. The visual patterns suggest a reversal in trends of the information quality score: Before the acquisition, both datasets exhibited slight improvements in information quality, but after the acquisition, the trends shifted, with the Twitter panel and Decahose showing a decline. The shaded regions, representing 95% confidence intervals, highlight the range of possible trend lines based on bootstrapped resampling.
The ITS analysis quantifies these shifts in information quality over time. Before the acquisition, the Twitter panel dataset showed an overall increasing trend, with information quality rising by an average of 0.34 points per month (β1, p ≤ .001). Immediately after the acquisition, there was a drop of 1.45 points (β2, p ≤ .01), followed by a shift in trend. While information quality was previously increasing, it began to decline at a rate of 0.37 points per month (β1 + β3 = 0.34 − 0.71) after the acquisition. For the Decahose dataset, the pre-acquisition trend was also positive but smaller in magnitude, increasing by 0.08 points per month (β1, p ≤ .05). After the acquisition, there was an immediate decrease of 1.39 points (β2, p ≤ .001), and the trend reversed direction, leading to a decline of 0.27 points per month (β1 + β3 = 0.08−0.35). The change in trend after intervention (β3) coefficients in Tables 1 and 2 capture these shifts, indicating that the positive trends observed before the acquisition turned negative afterward.
This suggests that the decline in information quality was not just a one-time drop (β₂) but a continuing trend (β₃) in the months following the acquisition. The results in Appendix A confirm the validity of these findings under an alternative information quality score, showing that the observed trends persist when applying different information quality scores. Additional robustness checks, including an analysis using a ±3-month window around the intervention, further support these results. This analysis confirms that the observed decline in information quality is statistically significant only when measured at the intervention date or after. This also indicates that the chosen time frame accurately captures the shift rather than reflecting random fluctuations in the preceding or following months.
While both the Decahose and panel datasets exhibit a clear reversal in information quality trends after Musk’s acquisition, key differences suggest that distinct mechanisms may be at play. The Decahose dataset, which reflects a dynamic user base, may capture shifts in platform composition, including the reintroduction of previously deplatformed accounts (Hickey et al., 2023), changes in bot activity (Barrie, 2023), or newly created accounts (Merrill & Harwell, 2023). Given that Decahose includes bots and automated entities, the decline in information quality may be partially driven by increased algorithmic amplification of low-quality content, coordinated influence operations, or shifts in engagement patterns triggered by these accounts (Ferrara et al., 2016). In contrast, the Panel dataset, with a fixed user sample, suggests that factors such as user disengagement or migration away from Twitter/X could also contribute to the observed decline. Rather than external amplification, this decline may be more authentically driven by real users, either through selective exit from the platform or concentrated groups proactively engaging with lower-quality content (Baribi-Bartov et al., 2024; Budak et al., 2024; Grinberg et al., 2019). These differences underscore the complex interplay between structural platform changes and user-driven behavioral shifts in shaping the evolving information ecosystem.
The effect sizes are small on a 0–100 scale, and the overall information quality of the ecosystem remains above NewsGuard’s high-credibility threshold, as the platform continues to be largely composed of high-quality content, consistent with previous research (Budak et al., 2024). However, if these trends persist, they may signal deeper structural changes. As we examine in the next section, focusing only on the average effect can obscure important shifts occurring in smaller pockets of lower-quality information. These subtle, yet significant, changes contribute to the overall decline in information quality. Following this trend, the next question is: Is the deterioration in information quality due to an increasing share of lower-credibility sources, a decreasing share of higher-credibility sources, or both? To answer this, we examined how the composition of shared content has shifted over time.
| CI | |||||
| Variable | Coef | SE | p < |t| | [0.25 | 0.975] |
| Intercept (β0) | 83.7815*** | 0.242 | 0.000 | 83.03 | 84.533 |
| Trend Before Intervention (β1) | 0.3430*** | 0.063 | 0.000 | 0.202 | 0.484 |
| Intervention (β2) | -1.4523** | 0.547 | 0.008 | -2.725 | -0.180 |
| Change in Trend After Intervention (β1 + β3) | -0.7086*** | 0.123 | 0.000 | -1.045 | -1.045 |
| CI | |||||
| Variable | Coef | SE | p < |t| | [0.25 | 0.975] |
| Intercept (β0) | 84.866*** | 0.237 | 0.000 | 84.402 | 85.33 |
| Trend Before Intervention (β1) | 0.0802* | 0.032 | 0.013 | 0.017 | 0.143 |
| Intervention (β2) | -1.3904*** | 0.434 | 0.001 | -2.242 | -0.539 |
| Change in Trend After Intervention (β1 + β3) | -0.3471** | 0.123 | 0.005 | -0.588 | -0.106 |
Finding 2: The decline in information quality is driven by a shift in the market share of information sources: lower-quality sources have gained a larger market share, while higher-quality sources have seen a reduction.
To examine how the composition of shared content has changed over time, we analyzed shifts in content volume and market share across credibility categories in the Decahose and Twitter panel datasets. Figure 2 presents these changes, illustrating how the distribution of shared information has evolved. As explained in Finding 1, NewsGuard categorizes sources into four credibility groups based on journalistic standards: 1) credible (75–100), 2) credible with exceptions (60–74), 3) proceed with caution (40–59), and 4) proceed with maximum caution (0–39). These classifications help distinguish between lower- and higher-credibility sources, with a threshold score of 60 serving as the dividing line between high- and low-quality sources, a framework also used in prior research (Baribi-Bartov et al., 2024). Figures 2 and 3 build on this classification system to examine shifts in the composition of shared content. Figure 2 presents changes in content volume and market share across all four NewsGuard categories, illustrating how content distribution evolved across the full credibility spectrum. Figure 3 simplifies this by aggregating sources into two broad groups, high-quality (≥60) and lower-quality (<60), allowing for a more direct assessment of the overall shift in information quality before and after the acquisition.
Both figures rely on two key measures. Content volume change represents the percentage difference between the averages of daily information quality scores before and after the acquisition, using bootstrapped samples to capture distributional shifts beyond just the mean. Market share change represents the percentage difference in the daily share of each information quality group relative to the entire information ecosystem over the same period. The results reveal a clear shift in the composition of shared content, with lower-credibility sources gaining prominence as higher-credibility sources decline. Figure 2 shows a set of box plots based on bootstrap estimates: The first row displays the Decahose dataset and the second row shows the Twitter panel dataset. The left column presents percentage changes in content volume, while the right column depicts changes in market share across the four NewsGuard credibility categories. Each box represents the distribution of bootstrap values, with the central line marking the median.
In the Decahose dataset (top-left), volume decreases across most credibility bins, except for the 40–59 group, which shows a median increase of 10.69%. The largest decline appears in the highest-credibility group (75–100) (-17.18%). In the corresponding market share box plot (top-right), the 40–59 category shows the largest gain (+29.43%), followed by smaller increases in the 0–39 and 60–74 bins (+15.12% and +12.03%). In the Twitter panel dataset (bottom row), volume declines across all bins (left), but the 40–59 group sees the smallest drop (-4.48%). This is reflected in its right-panel market share box plot, where it exhibits the largest gain (+30.12%), while the 0–39 and 75–100 groups remain relatively stable (-0.29% and -1.13%). These box plot distributions highlight how mid- and lower-credibility sources are gaining relative prominence in the shifting information ecosystem. In some cases, the box plots appear visually narrow because the bootstrap values are tightly clustered, indicating high consistency across samples. The underlying summary statistics for each box plot can be found in Appendix G.
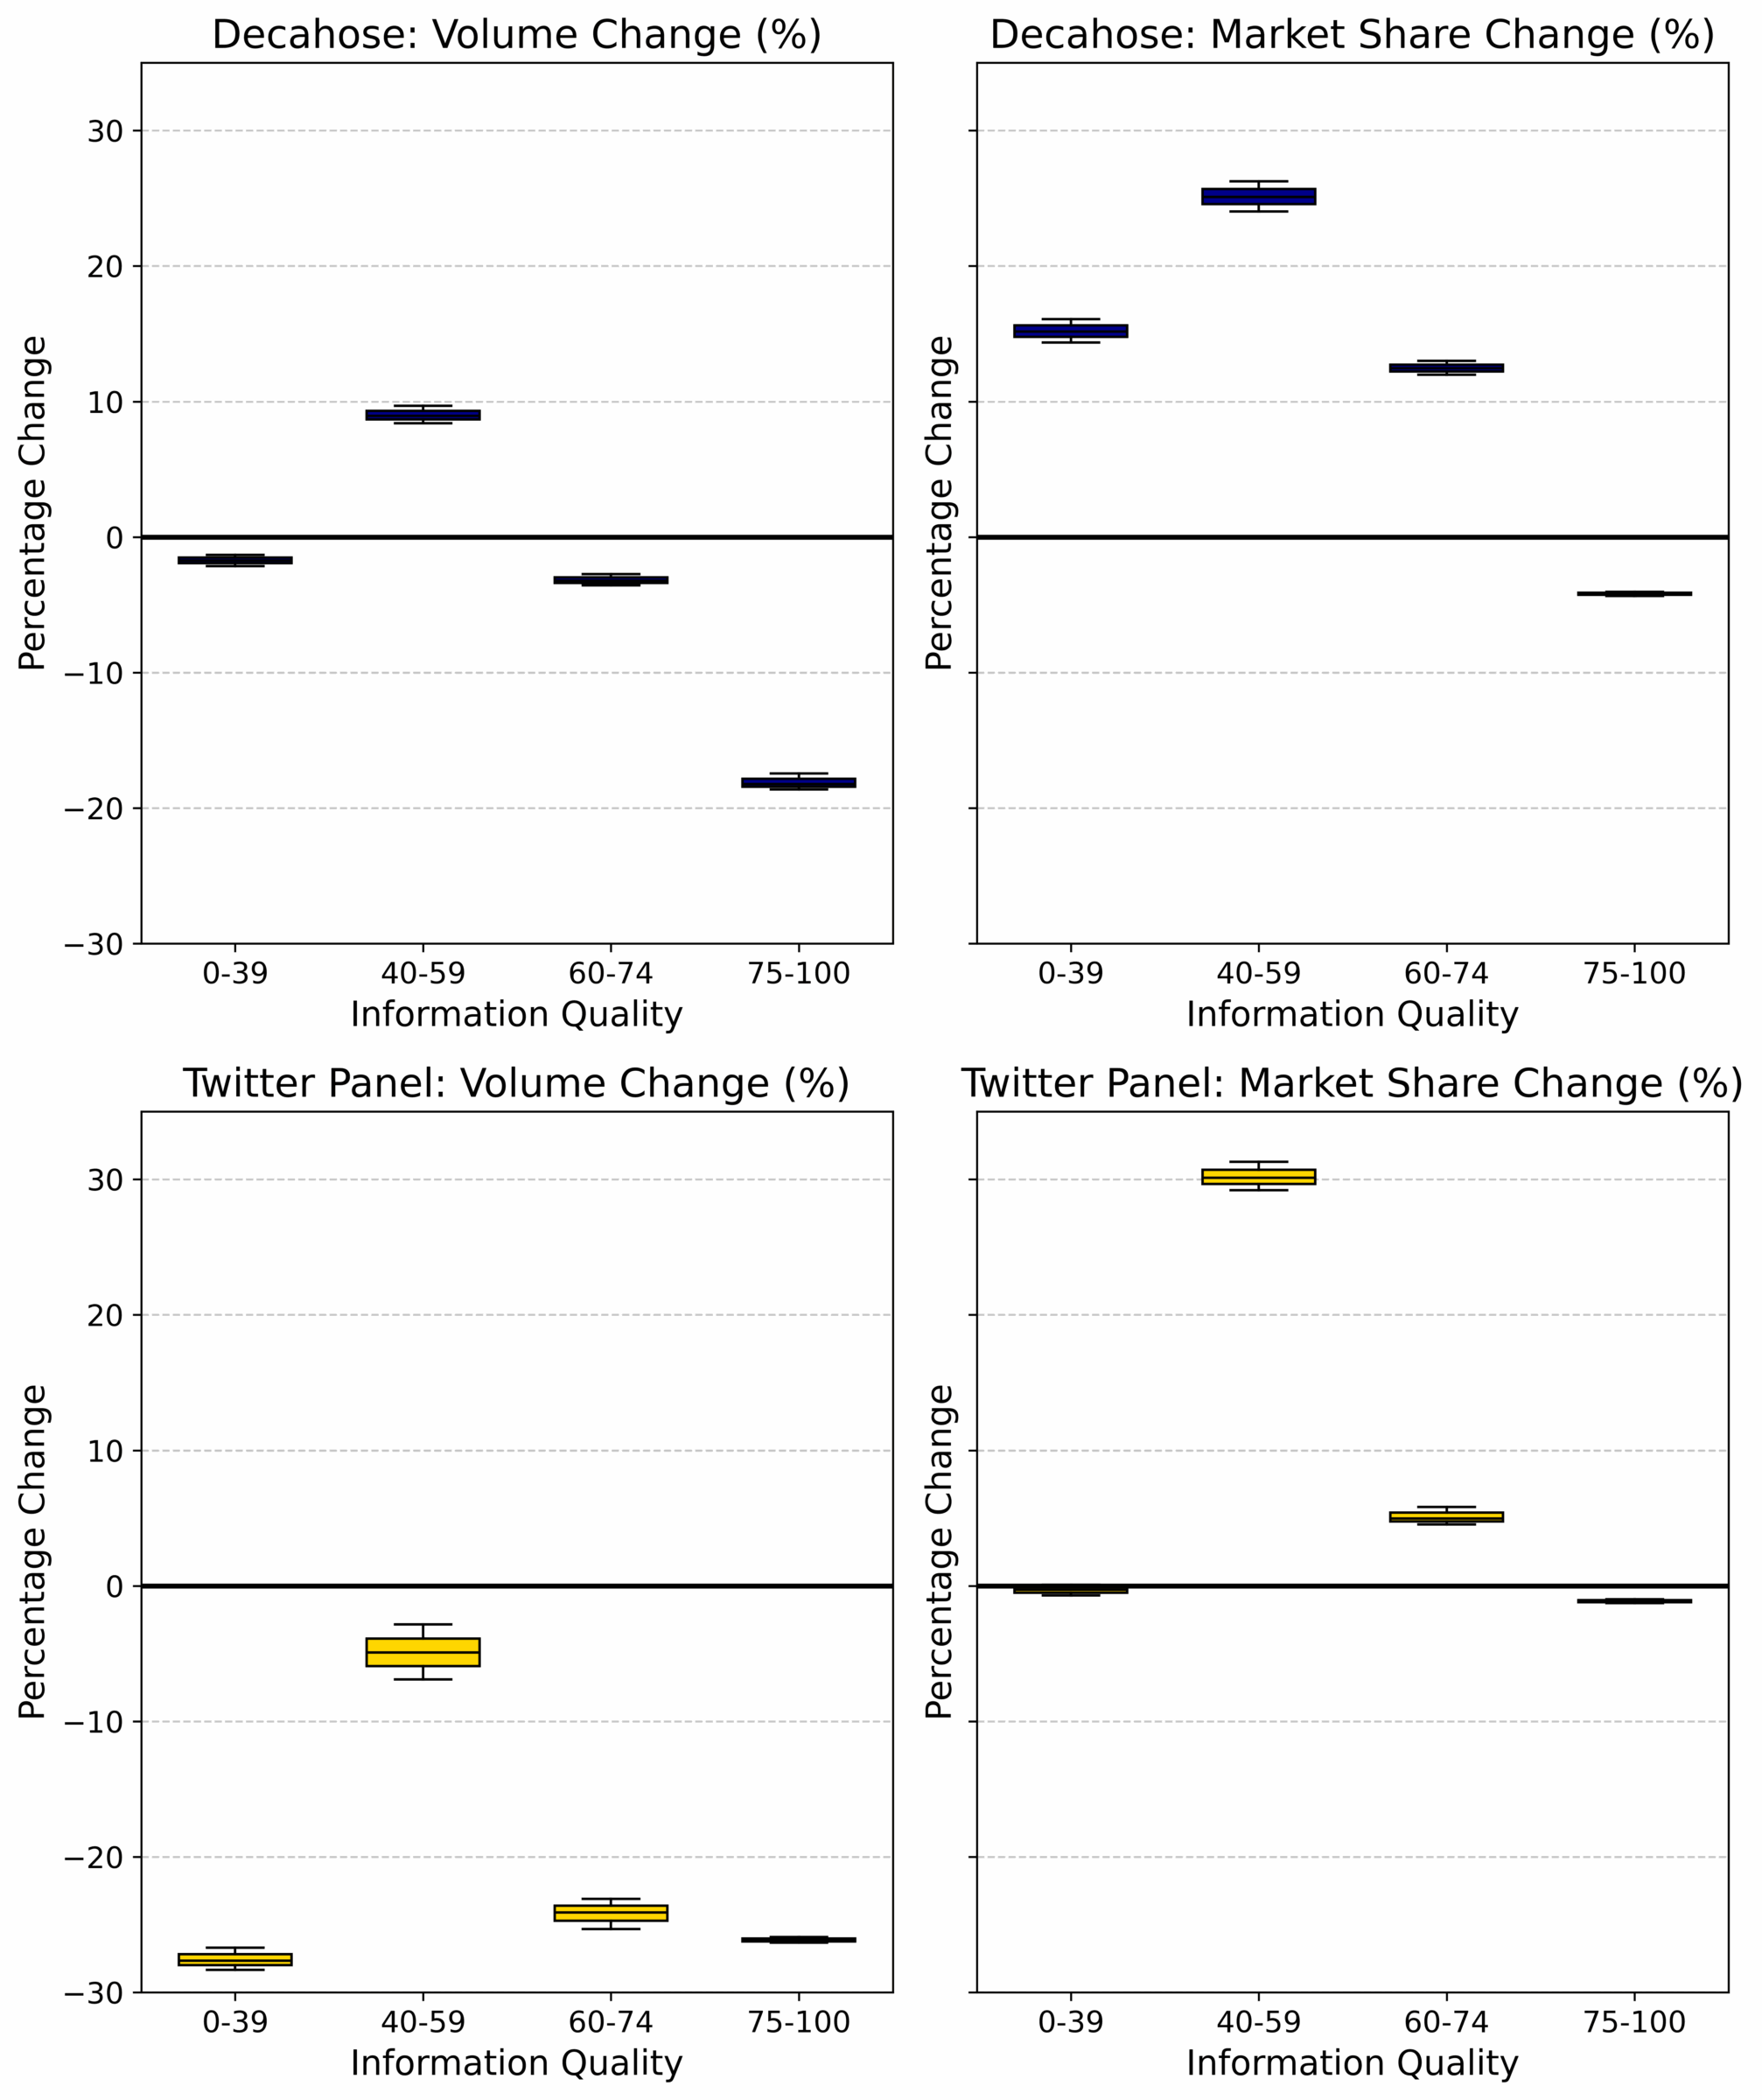
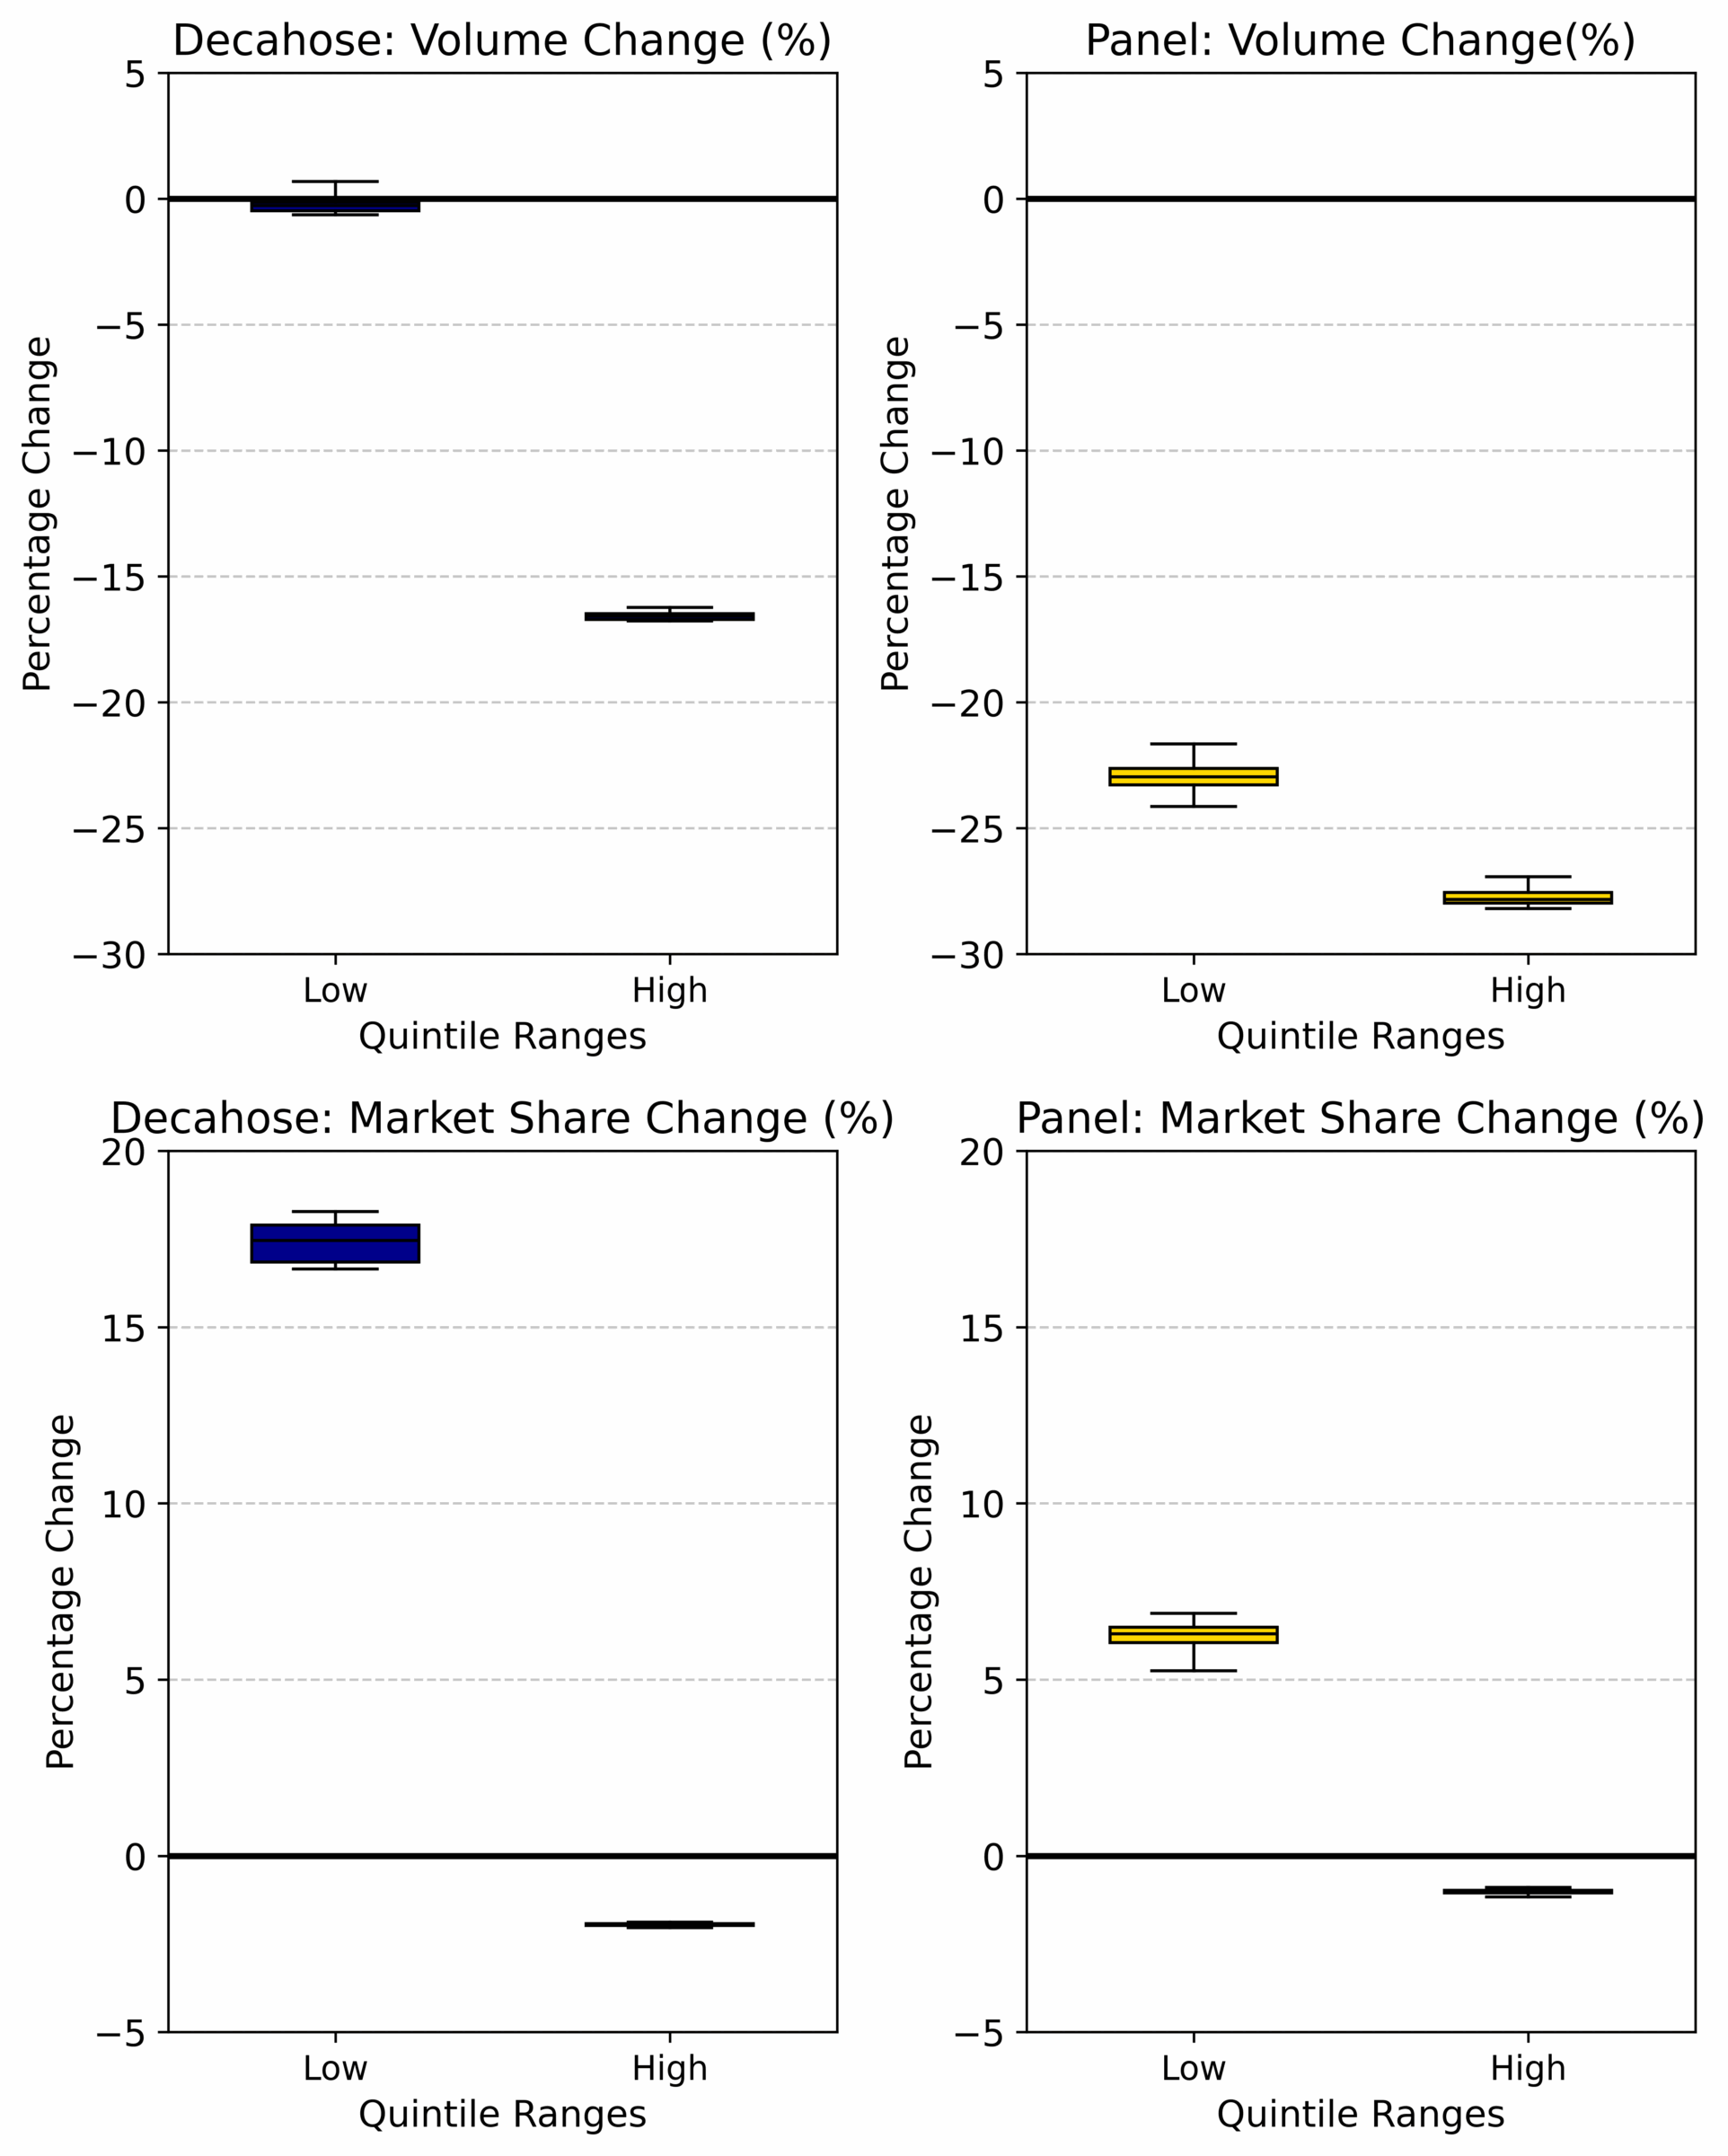
Figure 3 builds on the previous analysis by aggregating credibility categories into high- and low-quality groups, based on the NewsGuard threshold of 60, as described in the Methods section, thereby providing a broader view of information quality shifts. The color scheme is consistent with Figure 2, with dark blue representing the Decahose dataset and yellow indicating the Twitter Panel. However, the figure layout is intentionally reorganized: The first row presents changes in content volume, while the second row displays changes in market share. This reordering facilitates a clearer comparison between absolute (volume) and relative (market share) shifts across datasets when evaluating the performance of high- and low-credibility sources.
In the Decahose dataset, low-quality sources exhibit minimal change in content volume, with bootstrap estimates ranging from a slight decline to a modest increase. While the median suggests a small decrease (–0.28%), the overall distribution indicates relative stability, especially when contrasted with the sharp contraction among high-quality sources (–16.58%). In the Twitter panel dataset, both low- and high-quality sources experience a decline in volume, but the drop is substantially more pronounced for high-credibility sources (–27.84%) compared to their lower-credibility counterparts (–22.96%). This trend becomes even more apparent when examining market share dynamics. In the Decahose dataset, high-credibility sources not only decline in absolute volume but also lose relative market share, allowing low-credibility sources to occupy a greater portion of the shared content space. A similar pattern emerges in the Twitter panel dataset, where the sharp contraction in high-quality content creates a vacuum that lower-credibility sources increasingly fill.
Taken together, these patterns suggest a structural transformation in the platform’s information ecosystem: High-quality content is shrinking in both absolute and relative terms, while lower-credibility sources become more visible, either through expansion (as in Decahose) or by default (as in the Twitter Panel). This analysis also provides important context for interpreting effect sizes. Although some changes may appear small on a 0–100 scale, the joint decline in volume and market share reveals a broader contraction in high-quality content dissemination. This shift may stem from a combination of supply-side factors, such as news organizations reducing their Twitter/X activity, and user-level dynamics, including disengagement or platform departure among audiences seeking credible information.
While further investigation of the platform’s user base is warranted, our market share analysis suggests that less reliable content is becoming increasingly dominant in the post-acquisition information ecosystem. A detailed breakdown of market share by credibility category is presented in Appendix B, with Appendix C confirming the robustness of our findings using Lin et al.’s (2023) credibility scores. Appendix D highlights the domains with the largest percentage increases and decreases, showing that gains are concentrated among lower-credibility sources, while losses are primarily among high-credibility outlets.
Methods
We used two complementary datasets from Twitter/X: the Decahose and the Twitter panel. The Decahose is a dynamic 10% daily sample of global tweets, reflecting average platform behavior and including tweets from bots and organizations (Ferrara et al., 2016; Hickey et al., 2023). The Twitter panel, on the other hand, is a stable sample of 1.6 million U.S. users matched to voter files, offering insights into U.S.-based behavior over time while excluding new users (Hughes et al., 2021; Shugars et al., 2021). Together, these datasets provide complementary perspectives: the Decahose offers a view of global trends, including bot activity and organizational engagement, while the Twitter panel focuses on stable U.S.-based behavior.
We analyzed tweets from January 1, 2022, to April 30, 2023, with both datasets collectively containing 18,520,788,890 tweets. Within these datasets, 481,575,162 tweets in the Decahose and 8,196,662 tweets in the panel contained URLs, representing 2.6% and 2.1% of the total tweets, respectively. Our focus is on original tweets and retweets that include URLs, as these forms of sharing play a central role in shaping the digital information ecosystem. We excluded quote tweets and replies, which are more commonly used for commentary or critique rather than content endorsement. Unlike standalone tweets, which often express personal opinions or conversations, URL-sharing—particularly through original posts and retweets—connects users to external content, structuring the way information spreads and gains visibility across networks (Green et al., 2025). URL-sharing is also considered a stronger signal of endorsement, distinguishing it from other interactions such as quotes or replies (Joseph et al., 2019; Wojcieszak et al., 2022).
To evaluate the credibility of the content shared, we matched URLs from both datasets to NewsGuard domains, a widely used tool for assessing the transparency, factual reporting, and credibility of online content. In the Decahose dataset, we successfully matched 19% of URL-containing tweets to NewsGuard domains, while the matching rate in the Twitter panel dataset was 21% on average. The stability of our monthly matching rate, which underscores the reliability of our approach, is detailed in Appendix E.
We assessed information quality by matching URLs from both datasets to domains rated by NewsGuard, which assigns scores from 0 to 100 based on transparency and factual reporting. NewsGuard categorizes domains into five credibility levels: high credibility (100), generally credible (75–99), credible with exceptions (60–74), proceed with caution (40–59), and proceed with maximum caution (0–39). For example, reputable sources like wsj.com score near 100, while low-quality domains like infowars.com score closer to 0. Following NewsGuard’s methodology, a score of 60 served as the threshold to distinguish high-quality sources from lower-quality ones—a cutoff supported by prior research (Baribi-Bartov et al., 2024) as aligning well with other scoring and labeling systems (e.g., Lin et al., 2023). Because only a trivial number of sources in our dataset received a perfect score of 100, we merged those with the 75–100 range to form a broader “high credibility” category. Importantly, this classification is independent of political leaning; for example, both Fox News and CNN are coded as high-quality sources under this scheme.
In this analysis, we excluded domains categorized as “satire” and user-generated platforms, such as YouTube, Instagram, Facebook, and WordPress, which publish content from a wide range of sources with varying quality. Satirical sites, relying on fictional or exaggerated content for humor, could distort assessments of information quality. Similarly, user-generated platforms host content with diverse standards, complicating consistent evaluations of credibility. By focusing on traditional news sources, we improved the reliability and clarity of our findings on information quality trends. After applying these filters, we calculated the information quality (IQ) scores as the monthly average of the reliability scores for all included domains in each dataset. This method provides a comprehensive measure of the overall credibility of content shared on Twitter, enabling us to track trends in information quality and observe shifts in content credibility across different samples over time.
To evaluate the impact of Twitter’s ownership change on information quality, we employed an interrupted time series (ITS) analysis—a statistical method designed to capture both immediate and ongoing effects of an intervention, in this case, the ownership transition (Turner et al., 2021). Monthly IQ scores for both the Decahose and panel datasets were plotted, with trend lines estimated through the ITS model to compare the pre- and post-transition periods. We applied a bootstrapping approach to IQ values by resampling daily scores for each month with replacement 1,000 times and fitting an ITS model to each resampled dataset to calculate 95% confidence intervals around the trend lines.
We followed Huitema and McKean (2007) and used the Durbin-Watson test (Durbin & Watson, 1971) to assess autocorrelation in residuals. The test produced a score of 2.004 for the Decahose dataset, indicating no or minimal autocorrelation, and 1.22 for the Twitter Panel, suggesting some autocorrelation in residuals. Consequently, we employed ordinary least squares (OLS) regression with Newey-West (NW) standard error adjustment with lag-1 autocorrelation (Newey & West, 1987), which accounts for autocorrelation in the residuals.
We followed Huitema and McKean (2007) and used the Durbin-Watson test (Durbin & Watson, 1971) to assess autocorrelation in residuals. The test produced a score of 2.004 for the Decahose dataset, indicating no or minimal autocorrelation, and 1.22 for the Twitter Panel, suggesting some autocorrelation in residuals. Consequently, we employed ordinary least squares (OLS) regression with Newey-West (NW) standard error adjustment with lag-1 autocorrelation (Newey & West, 1987), which accounts for autocorrelation in the residuals.

Where:
- Yt represents the outcome variable measuring information quality at time t.
- β0 is the intercept, representing the baseline level of information quality before the intervention (Twitter’s ownership change).
- Trend Before Interventiont is a discrete variable that starts at 0 in the first month of observation and increases by 1 each subsequent month, capturing the underlying trend over time prior to the intervention.
- β1 captures the trend in information quality over time, prior to the intervention.
- Interventiont is a dummy variable that takes the value 0 before the ownership change and 1 afterward, marking the intervention point.
- β2 measures the immediate change in information quality at the time of the intervention.
- Trend After Interventiont is a discrete variable that takes values starting from 0 at the point of intervention and increases by 1 for each subsequent month. It captures any change in slope following the intervention, indicating the long-term impact on the trend.
- β3 measures the change in trend (slope) of the information quality trend after the intervention, reflecting whether the rate of increase or decrease in information quality has shifted as a result of the intervention.
- 𝜀t is an error term, allowing to deviate from the fitted model.
We performed several robustness checks to validate the ITS analysis. First, we assessed multicollinearity among predictor variables using the variance inflation factor (VIF) and confirmed that all values remained below 5, indicating that collinearity was not a concern. To test the sensitivity of the intervention effect, we shifted the intervention date by one, two, and three months before and after the actual date, re-estimating the model each time. We then compared the results to assess whether the significance and magnitude of the intervention effect remained stable. Our findings show that the intervention effect was only statistically significant after the intervention date, reinforcing the validity of our results. Additionally, we employed an autoregressive integrated moving average (ARIMA) model to account for potential autocorrelation and time-dependent structures in the data. By comparing the ITS estimates with those from the ARIMA model, we ensured that the observed effects were not artifacts of linear modeling assumptions. These robustness checks confirm that the estimated intervention effect is not driven by model specification but rather reflects substantive changes in the data. The robustness check results can be found in Appendix F.
To calculate changes in volume and market share within each NewsGuard quality bucket, we defined the “before” period as the 10 months leading up to the ownership change and the “after” period as the 6 months following it. For each period, we calculated the monthly average volume by dividing the total number of shared URLs by the number of months in the respective period. Similarly, we computed the monthly average market share for each quality bucket as the percentage of the total volume attributed to that bucket. The percentage change was then calculated by comparing the after-period averages to the before-period averages using the formula: 100 x (after average−before average)/before average. This approach allowed us to assess shifts in content distribution across different levels of information quality.
Topics
Bibliography
Bail, C. A. (2021). Breaking the social media prism: How to make our platforms less polarizing. Princeton University Press.
Baribi-Bartov, S., Swire-Thompson, B., & Grinberg, N. (2024). Supersharers of fake news on Twitter. Science, 384(6699), 979–982. https://doi.org/10.1126/science.adl4435
Barrie, C. (2023). Did the Musk takeover boost contentious actors on Twitter? Harvard Kennedy School (HKS) Misinformation Review, 4(4). https://doi.org/10.37016/mr-2020-122
Brewster, J., Wang, M., & Pavilonis, V. (2022, November 11). Twitter misinformation superspreaders see huge spike in engagement post-acquisition by Elon Musk. NewsGuard. https://www.newsguardtech.com/special-reports/twitter-misinformation-superspreaders-see-huge-spike-in-engagement-post-acquisition-by-elon-musk/
Budak, C., Goel, S., & Rao, J. M. (2016). Fair and balanced? Quantifying media bias through crowdsourced content analysis. Public Opinion Quarterly, 80(S1), 250–271. https://doi.org/10.1093/poq/nfw007
Budak, C., Nyhan, B., Rothschild, D. M., Thorson, E., & Watts, D. J. (2024). Misunderstanding the harms of online misinformation. Nature, 360, 45–53. https://doi.org/10.1038/s41586-024-07417-w
Chen, W., Pacheco, D., Yang, K.-C., & Menczer, F. (2021). Neutral bots probe political bias on social media. Nature Communications, 12, 5580. https://doi.org/10.1038/s41467-021-25738-6
Chou, W.-Y. S., Gaysynsky, A., & Cappella, J. N. (2020). Where we go from here: Health misinformation on social media. American Journal of Public Health, 110(S3), S273–S275. https://doi.org/10.2105/AJPH.2020.305905
Dias, N., Pennycook, G., & Rand, D. G. (2020). Emphasizing publishers does not effectively reduce susceptibility to misinformation on social media. Harvard Kennedy School (HKS) Misinformation Review, 1(1). https://doi.org/10.37016/mr-2020-001
Duffy, C., & LeBlanc, P. (2022, December 13). Elon Musk’s Twitter dissolves Trust and Safety Council moments before meeting. CNN Business. https://www.cnn.com/2022/12/13/tech/twitter-trust-safety-council-dissolved/index.html
Durbin, J., & Watson, G. S. (1971). Testing for serial correlation in least squares regression.III. Biometrika, 58(1), 1–19. https://doi.org/10.1093/biomet/58.1.1
Ferrara, E., Varol, O., Davis, C., Menczer, F., & Flammini, A. (2016). The rise of social bots. Communications of the ACM, 59(7), 96–104. https://doi.org/10.1145/2818717
Frenkel, S., & Conger, K. (2022, December 2). Hate speech’s rise on Twitter is unprecedented, researchers find. The New York Times. https://www.nytimes.com/2022/12/02/technology/twitter-hate-speech.html
Green, J., McCabe, S., Shugars, S., Chwe, H., Horgan, L., Cao, S., & Lazer, D. (2024). Curation bubbles. American Political Science Review, 118(1), 1–19. https://doi.org/10.1017/S0003055424000984
Grinberg, N., Joseph, K., Friedland, L., Swire-Thompson, B., & Lazer, D. (2019). Fake news on Twitter during the 2016 U.S. presidential election. Science, 363(6425), 374–378. https://doi.org/10.1126/science.aau2706
Guess, A. M., Lockett, D., Lyons, B., Montgomery, J. M., Nyhan, B., & Reifler, J. (2020). “Fake news” may have limited effects beyond increasing beliefs in false claims. Harvard Kennedy School (HKS) Misinformation Review, 1(1). https://doi.org/10.37016/mr-2020-004
Guess, A. M., Malhotra, N., Pan, J., Barberá, P., Allcott, H., Brown, T., Crespo-Tenorio, A., Dimmery, D., Freelon, D., Gentzkow, M., González-Bailón, S., Kennedy, E., Kim, Y. M., Lazer, D., Moehler, D., Nyhan, B., Rivera, C. V., Settle, J., Thomas, D. R., Thorson, … Tucker, J. A. (2023). How do social media feed algorithms affect attitudes and behavior in an election campaign? Science, 381(6656), 398–404. https://doi.org/10.1126/science.abp9364
Guess, A. M., Nyhan, B., O’Keeffe, Z., & Reifler, J. (2020). The sources and correlates of exposure to vaccine-related (mis)information online. Vaccine, 38(49), 7799–7805. https://doi.org/10.1016/j.vaccine.2020.10.018
Hickey, D., Schmitz, M., Fessler, D., Smaldino, P. E., Muric, G., & Burghardt, K. (2023). Auditing Elon Musk’s impact on hate speech and bots. Proceedings of the International AAAI Conference on Web and Social Media, 17(1), 1133–1137. https://doi.org/10.1609/icwsm.v17i1.22222
Horwitz, J., & Seetharaman, D. (2021, September 15). Facebook tried to make its platform a healthier place. It got angrier instead. The Wall Street Journal. https://www.wsj.com/articles/facebook-algorithm-change-zuckerberg-11631654215
Hughes, A. G., McCabe, S. D., Hobbs, W. R., Remy, E., Shah, S., & Lazer, D. M. J. (2021). Using administrative records and survey data to construct samples of tweeters and tweets. Public Opinion Quarterly, 85(S1), 323–346. https://doi.org/10.1093/poq/nfab020
Huitema, B. E., & McKean, J. R. (2007). The analysis of covariance: Theory and practice. CRC Press.
Joseph, K., Swire-Thompson, B., Masuga, H., Baum, M. A., & Lazer, D. (2019). Polarized, together: Comparing partisan support for Trump’s tweets using survey and platform-based measures. Proceedings of the International AAAI Conference on Web and Social Media, 13(1), 290–301. https://doi.org/10.1609/icwsm.v13i01.3230
Lazer, D. M. J., Baum, M. A., Benkler, Y., Berinsky, A. J., Greenhill, K. M., Menczer, F., Metzger, M. J., Nyhan, B., Pennycook, G., Rothschild, D., Schudson, M., Sloman, S. A., Sunstein, C. R., Thorson, E. A., Watts, D. J., & Zittrain, J. L. (2018). The science of fake news. Science, 359(6380), 1094–1096. https://doi.org/10.1126/science.aao2998
Lin, H., Lasser, J., Lewandowsky, S., Cole, R., Gully, A., Rand, D. G., & Pennycook, G. (2023). High level of correspondence across different news domain quality rating sets. PNAS Nexus, 2(9), pgad286. https://doi.org/10.1093/pnasnexus/pgad286
Martiny, C. (2023, January 31). Friends in the ‘right’ places: An analysis of Elon Musk’s Twitter interactions before and after acquiring the platform. Institute for Strategic Dialogue. https://web.archive.org/web/20240722115933/https://www.isdglobal.org/digital_dispatches/friends-in-the-right-places-an-analysis-of-elon-musks-twitter-interactions-before-and-after-acquiring-the-platform/?ref=refind
Mac, R., Isaac, M., & McCabe, D. (2022, November 3). Elon Musk begins laying off Twitter employees. The New York Times. https://www.nytimes.com/2022/11/03/technology/twitter-layoffs-elon-musk.html
McCabe, S. D., Ferrari, D., Green, J., Lazer, D. M. J., & Esterling, K. M. (2024). Post-January 6th deplatforming reduced the reach of misinformation on Twitter. Nature, 630(8015), 132–140. https://doi.org/10.1038/s41586-024-07524-8
McCarthy, B. (2023, April 19). ‘Stamp of approval’: Twitter’s Musk amplifies misinformation. AFP Fact Check. https://factcheck.afp.com/doc.afp.com.33DG9P3
Merrill, J. B., & Harwell, D. (2023, August 15). Elon Musk’s X is throttling traffic to websites he dislikes. The Washington Post. https://www.washingtonpost.com/technology/2023/08/15/twitter-x-delays-links/
Newey, W. K., & West, K. D. (1987). A simple, positive semi-definite heteroskedasticity and autocorrelation consistent covariance matrix. Econometrica, 55(3), 703–708. https://doi.org/10.2307/1913238
NewsGuard. (n.d.). Website rating process and criteria. https://www.newsguardtech.com/ratings/rating-process-criteria/
O’Brien, M., & Ortutay, B. (2022, December 12). Musk’s Twitter disbands its Trust and Safety advisory group. Associated Press. https://apnews.com/article/elon-musk-twitter-trust-safety-council-disbanded-675db53734fc005d4b9c58f3c7a74886
Ognyanova, K., Lazer, D., Robertson, R. E., & Wilson, C. (2020). Misinformation in action: Fake news exposure is linked to lower trust in media, higher trust in government when your side is in power. Harvard Kennedy School (HKS)Misinformation Review, 4(1). https://doi.org/10.37016/mr-2020-024
O’Sullivan, D. (2022, December 12). Twitter disbands its ‘Trust and Safety Council’ that tackled harassment and child exploitation. CNN Business. https://www.cnn.com/2022/12/12/tech/twitter-trust-safety-council-disbanded/index.html
O’Sullivan, D., & Duffy, C. (2022, October 28). Elon Musk completes Twitter takeover and fires top executives. CNN Business. https://www.cnn.com/2022/10/27/tech/elon-musk-twitter-deal-closes/index.html
Pfeffer, J., Matter, D., Jaidka, K., Varol, O., Mashhadi, A., Lasser, J., Assenmacher, D., Wu, S., Yang, D., Brantner, C., Romero, D. M., Otterbacher, J., Schwemmer, C., Joseph, K., Garcia, D., & Morstatter, F. (2023). Just another day on Twitter: A complete 24 hours of Twitter data. arXiv. https://doi.org/10.48550/arXiv.2301.11429
Reuning, K., Whitesell, A., & Hannah, A. L. (2022). Facebook algorithm changes may have amplified local republican parties. Research & Politics, 9(2). https://doi.org/10.1177/20531680221103809
Sherman, A., & Thomas, L. (2022, December 13). Twitter disbands Trust and Safety Council amid Elon Musk’s overhaul. CNBC. https://www.cnbc.com/2022/12/13/twitter-disbands-trust-and-safety-council.html
Shugars, S., Gitomer, A., McCabe, S., Gallagher, R. J., Joseph, K., Grinberg, N., Doroshenko, L., Welles, B. F., & Lazer, D. (2021). Pandemics, protests, and publics: Demographic activity and engagement on Twitter in 2020. Journal of Quantitative Description: Digital Media, 1. https://doi.org/10.51685/jqd.2021.002
Turner, S. D., Rainer, H. W., & Esteban, J. (2021). Modeling interrupted time series for policy evaluation: Approaches and application. Journal of Econometrics, 202(1), 159–175. https://doi.org/10.1016/j.jeconom.2021.01.009
Vasist, P. N., Chatterjee, D., & Krishnan, S. (2023). The polarizing impact of political disinformation and hate speech: A cross-country configural narrative. Information Systems Frontiers, 26, 663–688. https://doi.org/10.1007/s10796-023-10390-w
Vosoughi, S., Roy, D., & Aral, S. (2018). The spread of true and false news online. Science, 359(6380), 1146–1151. https://doi.org/10.1126/science.aap9559
West, D. M. (2022, April 26). Five ways Elon Musk can transform Twitter. Brookings Institution. https://www.brookings.edu/articles/five-ways-elon-musk-can-transform-twitter/
Wojcieszak, M., Sobkowicz, P., Yu, X., & Bulat, B. (2022). What information drives political polarization? Comparing the effects of in-group praise, out-group derogation, and evidence-based communications on polarization. The International Journal of Press/Politics, 27(3), 354–380. https://doi.org/10.1177/19401612211004418
Funding
The authors gratefully acknowledge funding from the Knight Foundation. The funding body had no role in the design, interpretation, or reporting of the research.
Competing Interests
The authors declare no competing interests.
Ethics
Our analysis is conducted under Northeastern University’s Institutional Review Board (IRB) approval (ID: 17-12-13). While we rely on publicly available social media data and voting records, matching these datasets raises important ethical considerations. To address these concerns, we ensure that all data is securely stored on a protected server with access restricted to authorized members of the research team. Moreover, we strictly conduct, report, and share only aggregate-level analyses of the matched data and do not make the underlying individual-level data publicly available.
Copyright
This is an open access article distributed under the terms of the Creative Commons Attribution License, which permits unrestricted use, distribution, and reproduction in any medium, provided that the original author and source are properly credited.
Data Availability
All materials required to replicate this study, compliant with NewsGuard’s IRB and data-sharing policies, are available on the Harvard Dataverse: https://doi.org/10.7910/DVN/PFIRDJ