Peer Reviewed
People rely on their existing political beliefs to identify election misinformation
Article Metrics
0
CrossRef Citations
PDF Downloads
Page Views
Rather than assuming that people are motivated to fact-check, we investigated the process that people go through when and if they encounter political misinformation. Using a digital diary method, we asked 38 participants to collect examples of political misinformation during Australia’s 2025 federal election and explain why they determined it to be misinformation (n = 254). The top rationale given by participants for their decisions was that the claims contradicted their existing knowledge (28%), followed by perceptions of bias (22%). An independent fact checker analysed the examples and revealed a considerable gap: 10% of submissions were found to be false, while 37% were found to be true.

Research Questions
- What do audiences perceive as political misinformation during an election?
- How do they determine if it is misinformation?
- What do audiences do when they encounter political misinformation?
- How does the audiences’ perception of political misinformation differ from that of an independent fact checker?
Essay Summary
- We collected data during the 2025 Australian federal election using a digital diary method. Participants (n = 38) were asked to send photos/screenshots of or links to political misinformation they encountered each day for seven days (Saturday, April 26, to Friday, May 2, 2025) before the election. Each of the 254 examples was then fact-checked by a professional fact checker.
- We found that audiences apply various methods to verify dubious information. In 28% of the examples, participants’ existing knowledge or experience was applied. If inconsistencies arise, they tend to classify them as misinformation. The second most frequent approach (22%) is when the content is deemed biased. A very small proportion of examples (4%) were verified by checking authoritative sources or trusted individuals.
- When encountering misinformation, the most reported response is “doing nothing” (44%), followed by “sharing or discussing with others” (21%).
- We also compared participants’ perceptions of misinformation with the verification results from an independent, professional fact checker. The analysis revealed a notable gap. 10% of the examples provided by the diary participants were identified as political misinformation by the fact checker, and 37% were found to be factual information.
- These findings reinforce the idea that perceptions of political misinformation are determined by an individual’s partisan worldview. With such a small proportion of people choosing to fact-check, political actors are effectively free to make unverified claims during an election, knowing that citizens are unlikely to check and hold them to account.
Implications
This study examines how people manage information overload, where citizens are exposed to an abundance of information in the context of a federal election. It examines people’s everyday encounters with misinformation and how they identify it. Rather than assuming that people are motivated to fact-check, consume, and share accurate information, we seek to understand the process that people go through when and if they encounter what they think is misinformation.
People’s definitions and perceptions of misinformation vary (Nielsen & Graves, 2017). For some, it is based on perceptions of bias and partisanship, poor quality journalism, inaccuracy, rumors, conspiracy theories, lies, satire, unfavorable media coverage, disinformation, and “fake news” (Tandoc et al., 2017). For many, the intention of the information producer to mislead the audience is key, followed by signs of exaggeration, incomplete information, and presenting rumor or opinion as fact (Osman et al., 2022). Our research found elements of the above perceptions of misinformation, particularly around bias and partisanship. We found several key implications: 1) people reject claims that are counter to their existing beliefs, 2) the cluttered online information environment disincentivizes fact-checking, 3) information burnout leads to less fact-checking, and 4) people have low levels of media literacy, which exacerbates the impact of misinformation. These last two implications, in particular, point to a need for truth in political advertising. But, more importantly, what citizens view as misinformation does not match what professional fact checkers do.
People reject claims that are counter to their existing beliefs
To understand what happens when people encounter misinformation, we need to consider how people process information generally. People are biased toward accepting information as true, especially when relying on their “gut feeling.” Repetition also increases belief in both facts and misinformation—namely, the “illusory truth effect” (Hassan & Barber, 2021, p.1). The illusory truth effect is a cognitive bias in which people are more likely to believe information as true simply because they have heard or seen it repeatedly —even when it is false. When combined with how easily a person can process information and internal cohesion within the information, these act as heuristics for assessment and can be exploited by misinformation (Ecker et al., 2022).
People can still believe in false information even if it contradicts factual knowledge (Fazio et al., 2015). This is because acceptance is spontaneous when people process information, but rejection of information as false involves an additional process that requires motivation and cognitive resources (Gilbert, 1991). People tend to affirm their existing beliefs. When information does not align with their beliefs, they tend to determine it as false.
Our analysis shows that participants who judged the content to be false because it was contrary to their existing knowledge had the highest certainty score, meaning it was one of the strongest cues. When they see information that counters their beliefs, they are likely to question it. These attitudes and beliefs can override critical reasoning. If a fact or claim is presented as a threat to one’s beliefs, then it is more likely to be rejected (Pantazi et al., 2021).
The cluttered online information environment disincentivizes fact-checking
On digital platforms, people struggle to cope with information overload, and this experience of an overwhelming environment shapes who and what people choose to trust online. It is not surprising that people mainly do nothing when they come across misinformation (McGuinness et al., 2025). Geeng et al. (2020) found that people do not investigate dubious information when they experience political burnout. This means that, regardless of the ability to identify misinformation, people may not actually apply that skill or knowledge. Audiences who find it hard to know what is true or not may disengage altogether (Chan et al., 2022). To manage large volumes of information online, people develop their own strategies, including the use of mental shortcuts and processes (Pennycook & Rand, 2022). People can be biased toward accepting information as true, especially when relying on their intuition (Ecker et al., 2022).
Given that political misinformation is one of the top concerns among Australians when it comes to the issue of misinformation (Park et al., 2022) and that there is a broad support for stronger regulation (Notley et al., 2024), there is a clear need for national truth-in-political-advertising laws to prevent politicians and third parties from spreading demonstrably false claims.
People have low levels of media literacy, which exacerbates the impact of misinformation
Our findings reveal that people, particularly those with strong partisan beliefs, are highly susceptible to political misinformation. A very small proportion of participants actively sought to fact-check dubious election information. Most worryingly, the majority of the participants failed to identify or falsely identified political misinformation. In fact, studies have shown a concerningly low level of ability among citizens to properly verify information (McGuinness et al., 2025; Park et al., 2024). As the analysis above shows, people are rarely motivated to fact-check and usually make judgements about misinformation based on their own experience and prior knowledge, particularly when there is an information overload.
Factual misperceptions can be corrected through forewarning and labelling, prebunking interventions (inoculation), and debunking (providing fact-checking services after the fact). However, there are mixed results on their effectiveness (Butler et al., 2024; Chan et al., 2017; van Huijstee et al., 2025). This highlights the need for broad media literacy education, particularly among adults no longer connected with formal education. The voting public needs the skills to assess the veracity of information that does not cohere with their existing beliefs and to have the ability, motivation, and mindset to adequately respond to misinformation.
Having a critical mindset is an important element of media literacy. A critical mindset can help overcome belief perseverance bias, where people still believe something even after it has been determined to be misinformation (van Huijstee et al., 2025). Cognitive reflection is an important element of processing information analytically (Facciani, 2025) and is one of the elements of media literacy education that can reduce the spread of misinformation (Guess et al., 2020; Roozenbeek & van der Linden, 2019). An important aspect of cognitive reflection is possessing intellectual humility. Intellectual humility is the propensity to recognize the limits of one’s knowledge and openness to new information (Leary et al., 2017). It enables people to be aware of their own fallibility without feeling threatened (Krumrei-Mancuso & Rouse, 2016). This component of media literacy can be effective in reducing the impact of misinformation because it means that one is open to other people’s opinions and motivates an individual to verify information if something is dubious.
Findings
Finding 1: People judge political misinformation based on their own beliefs.
We asked participants to rate each example they found on a five-point scale (1 = somewhat sure, 5 = completely sure), indicating their level of certainty that the content was misinformation, and to provide reasons why. The mean rating was 3.52 (SD = 1.20). Table 1 presents the distribution of reasons identified.
The most frequent rationale was that the content was contrary to their existing knowledge or experience (28%), followed by perceptions of bias (22%). 17% of responses were coded as indicating that some examples lacked sufficient evidence or context. Emotional content, such as fearmongering, accounted for 13% of the judgements, while 13% of the claims were considered implausible. Notably, only 4% of responses were based on external verification, with very few participants fact-checking the claims by seeking authoritative sources or asking other people they trust.
| Variable | n | % |
| Contrary to existing knowledge or experience | 60 | 28 |
| Biased | 47 | 22 |
| Insufficient evidence/out of context | 36 | 17 |
| Emotional | 28 | 13 |
| Implausible | 27 | 13 |
| External verification | 9 | 4 |
| Did not state a reason | 5 | 2 |
| Other | 2 | 1 |
We further examined if there was a difference in the mean level of certainty that participants had in the misinformation examples they identified, depending on how they had determined them to be misinformation. Examples that were deemed to be false or misleading because they were contrary to their existing knowledge or experience had the highest certainty score (M = 3.89). Similarly, examples that were determined as misinformation based on reactions to emotional content (M = 3.80) or external verification (M = 3.75) also had high levels of certainty. On the other hand, examples that were identified as misinformation due to bias had the lowest levels of confidence (M = 3.17) (see Table 2).
| Variable | n | mean | SD |
| Biased | 46 | 3.17 | 1.1 |
| Contrary to existing knowledge | 57 | 3.89 | 1.05 |
| Emotional | 25 | 3.8 | 1.08 |
| External verification | 8 | 3.75 | 1.28 |
| Implausible | 27 | 3.52 | 1.42 |
| Insufficient evidence/out of context | 35 | 3.4 | 1.19 |
Finding 2: When people encounter misinformation, almost half choose to do nothing.
The most commonly reported action taken when participants encountered misinformation was “doing nothing” (44%), followed by “sharing or discussing with others” (21%). In addition, 17% of the content was verified through online searching, while 10% was scrutinized closely but without external verification (see Table 3). With such a large difference between the first and second response, it is worth suggesting that future research explores whether doing nothing has implications or consequences for civic discourse.
| Variable | n | % |
| Nothing | 98 | 44 |
| Share or discuss with others | 47 | 21 |
| Search for more information | 38 | 17 |
| Reread/scrutinize/re-watch/engage further | 23 | 10 |
| Dismissive emotional response | 14 | 6 |
| Ignored/avoid | 9 | 4 |
| Deleted the message | 4 | 2 |
| Reported it to the platform/website/group admin | 1 | 0.4 |
Finding 3: There is a big gap between audience perception and that of a fact checker.
We analyzed if participants’ perceptions of misinformation aligned with the verification results provided by the fact checker. The analysis revealed a notable gap. Ten percent of the examples provided by participants were identified as false by the fact checker, while 37% were found to be true. Among the cases, 24% were classified by the fact checker as misleading, 14% as lacking evidence, and 12% as missing context (see Table 4).
| Variable | n | % |
| True | 57 | 37 |
| Misleading | 37 | 24 |
| No evidence | 22 | 14 |
| Missing context | 19 | 12 |
| False | 15 | 10 |
| Satire | 6 | 4 |
| Total | 156 | 100 |
We further examined the fact checker’s verification results according to how participants determined misinformation. Content verified as true was more frequently found among claims judged by participants as implausible (44%), lacking sufficient evidence (41%), or based on emotional responses (39%). On the other hand, only one item was verified as false by the fact checker among the cases where participants relied on external sources to validate the claim.
An example of factual information claimed as misinformation by a participant is an advertisement the participant saw on television that cited a news article that contained OECD figures showing Australia having had a larger fall in disposable income compared to other OECD countries. The participant claimed this was “false and wrong” and a “scare tactic,” based on their existing beliefs that the Labor government had performed well economically. Another example is a news article with a headline saying, “Coalition proposes ‘migrating’ public servants to regions in last-minute tweak to plan to slash workforce.” The participant claimed it was misinformation because “How can you force someone to move to a regional location? It’s just ridiculous.” Both articles were verified to be correct by the fact-checker.
Finding 4: Almost half of the examples provided by participants were found on social media platforms.
We first analyzed the political misinformation examples shared by participants during the election based on medium, creator, and narrative. As shown in Table 5, nearly half of the examples (47%) were found on social media platforms (primarily on Facebook [19%] and Instagram [18%]), followed by traditional news media (TV [14%] and newspapers [5%]).
The most frequently identified creators were political parties or politicians (49%), followed by mainstream news outlets (18%). Social media influencers, activists, and alternative media were also noted as sources. In terms of content, most misinformation examples were related to election policies (49%) or targeted specific candidates and parties (41%). Among the misinformation examples, 33% were paid political advertisements, while only 2% were AI-generated content.
| Category | Variable | n | % |
| Medium | Social media | 118 | 47 |
| TV | 35 | 14 | |
| Offline materials | 23 | 9 | |
| Online news website | 22 | 9 | |
| Non-identifiable | 22 | 9 | |
| Search platforms | 15 | 6 | |
| Newspaper | 13 | 5 | |
| Creator | Political party websites | 6 | 2 |
| Political party/politician | 118 | 49 | |
| Mainstream news media | 42 | 18 | |
| Individual creator/Influencer | 19 | 8 | |
| Activist/advocacy organization | 15 | 6 | |
| Alternative/independent media | 11 | 5 | |
| Journalists | 5 | 2 | |
| Institutions or think tank organization | 4 | 2 | |
| Unknown/non-identifiable | 25 | 10 | |
| Narrative | Targeting candidates/parties including policies | 64 | 41 |
| Policies | 77 | 49 | |
| Other | 7 | 4 | |
| Unrelated to election | 8 | 5 | |
| Paid ad | Yes | 84 | 33 |
| No | 170 | 67 | |
| AI use | Yes | 6 | 2 |
| No | 248 | 98 |
Methods
A digital diary method was used to collect data during the Australian federal election in 2025. Participants came from a variety of backgrounds while also being balanced for age and gender. We ensured that those who were less frequent users of news (less often than once a day) were included. Participants were recruited from marginal electorates: Deakin (in Victoria), Dickson (in Queensland), Gilmore (in New South Wales), and Werriwa (also in New South Wales). These four electorates included suburban, outer-metropolitan, or regional populations and were held before the election by a sitting candidate with a small margin. Those who participated received a small incentive as part of their existing agreement with YouGov (see Appendix).
This study focuses on the seven-day period preceding the election (Saturday, April 26, to Friday, May 2, 2025), a phase characterized by intensified campaigning and increased circulation of political information and misinformation (Moore et al., 2023). Forty-five participants were recruited by YouGov. Participants were asked to send one or more pieces of misinformation they encountered each day for the period. To minimize positive false submissions, we kept this requirement flexible. The number of examples submitted ranged from 1 to 14, with an average number of 6.5. Ten participants submitted fewer than four over the course of seven days. Seven participants did not submit any examples and were excluded from the analysis.
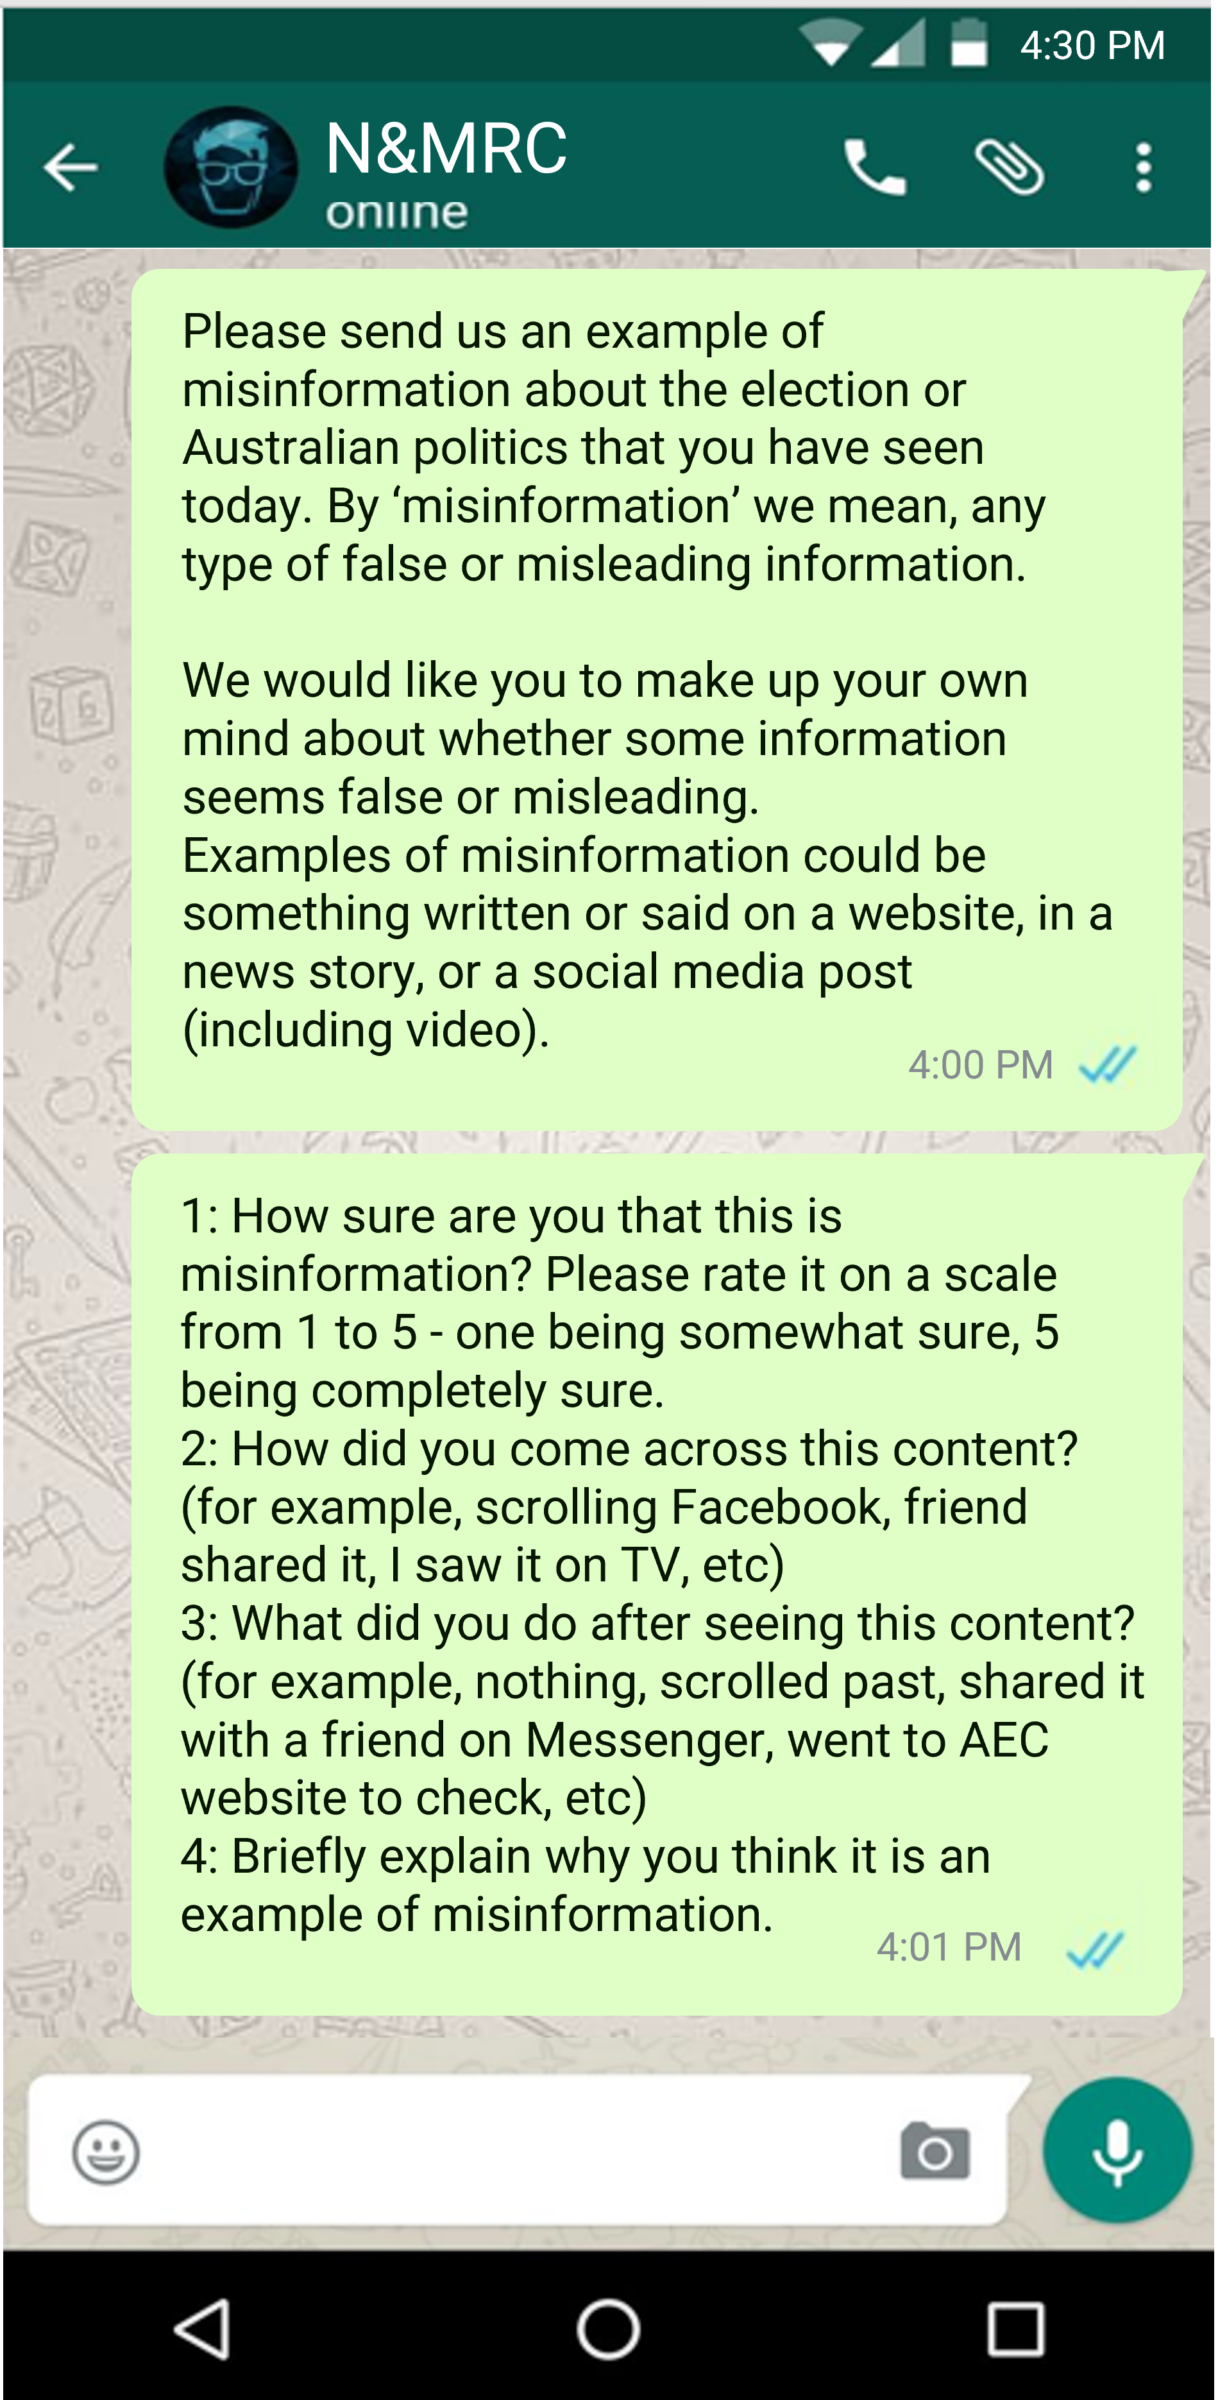
The election was held on May 3, 2025. Daily prompts were sent via WhatsApp at 4:00 pm AEST as a reminder to complete the task by midnight. The prompts were divided into two WhatsApp messages (see Figure 1).
For the coding, five members of the research team coded the data from May to August, 2025. The coding scheme was based on the four questions sent to participants and additional information, including date, medium/channel, source of claim, and whether the example was a paid ad. After initial coding, 10% of the coding was randomly selected and coded by Coder A. Coder A’s coding was cross-checked by Coder B. The intercoder reliability ranged from 82% to 97%, based on the agreement level between two coders.
Finally, an independent, professional fact checker analyzed the misinformation examples to verify whether they were deemed misinformation. The fact checker had more than ten years of experience as a journalist, working as a fact-checking editor and correspondent for major news organizations, and is currently a fact-checking specialist and producer for an international news organization. The criterion for selecting the fact checker was that they have fact-checking experience for major outlets to best reflect the practices of news organizations.
Limitations
Misinformation proliferates all year round and not just during the election. Misinformation campaigns are usually targeted and heightened during the weeks leading up to the election. Therefore, the diary activities may not have fully captured all types of misinformation and participant responses. Another limitation is the size of the study. We do not suggest that this data can be extrapolated across the Australian population. It was conducted in four marginal seats, out of the 150 in the Australian House of Representatives, in the states of New South Wales, Victoria, and Queensland. Future research could expand the scope of the project to include other seats, other states, and a wider cohort.
Topics
Bibliography
Butler, L. H., Prike, T., & Ecker, U. K. H. (2024). Nudge-based misinformation interventions are effective in information environments with low misinformation prevalence. Scientific Reports, 14(1), Article 11495. https://doi.org/10.1038/s41598-024-62286-7
Chan, M. P. S., Jones, C. R., Hall Jamieson, K., & Albarracín, D. (2017). Debunking: A meta-analysis of the psychological efficacy of messages countering misinformation. Psychological Science, 28(11), 1531–1546. https://doi.org/10.1177/0956797617714579
Chan, M., Lee, F. L. F., & Chen, H. T. (2022). Avoid or authenticate? A multilevel cross-country analysis of the roles of fake news concern and news fatigue on news avoidance and authentication. Digital Journalism, 12(3), 356–375. https://doi.org/10.1080/21670811.2021.2016060
Ecker, U. K., Lewandowsky, S., Cook, J., Schmid, P., Fazio, L. K., Brashier, N., Kendeou, P., Vraga, E. K., & Amazeen, M. A. (2022). The psychological drivers of misinformation belief and its resistance to correction. Nature Reviews Psychology, 1(1), 13–29. https://doi.org/10.1038/s44159-021-00006-y
Facciani, M. (2025). Misguided: Where misinformation starts, how it spreads, and what to do about it. Columbia University Press. https://www.jstor.org/stable/10.7312/facc20504
Fazio, L. K., Brashier, N. M., Payne, B. K., & Marsh, E. J. (2015). Knowledge does not protect against illusory truth. Journal of Experimental Psychology: General, 144(5), 993–1002. https://doi.org/10.1037/xge0000098
Geeng, C., Yee, S., & Roesner, F. (2020). Fake news on Facebook and Twitter: Investigating how people (don’t) investigate. In CHI ’20: Proceedings of the 2020 CHI Conference on Human Factors in Computing Systems (pp. 1–14). Association of Computing Machinery. https://doi.org/10.1145/3313831.3376784
Gilbert, D. T. (1991). How mental systems believe. American Psychologist, 46(2), 107–119. https://doi.org/10.1037/0003-066X.46.2.107
Guess, A. M., Lerner, M., Lyons, B., Montgomery, J. M., Nyhan, B., Reifler, J., & Sircar, N. (2020). A digital media literacy intervention increases discernment between mainstream and false news in the United States and India. Proceedings of the National Academy of Sciences, 117(27), 15536–15545. https://doi.org/doi:10.1073/pnas.1920498117
Hassan, A., & Barber, S. J. (2021). The effects of repetition frequency on the illusory truth effect. Cognitive Research: Principles and Implications, 6, Article 38. https://doi.org/10.1186/s41235-021-00301-5
Krumrei-Mancuso, E. J., & Rouse, S. V. (2016). The development and validation of the comprehensive intellectual humility scale. Journal of Personality Assessment, 98(2), 209–221. https://doi.org/10.1080/00223891.2015.1068174
Leary, M. R., Diebels, K. J., Davisson, E. K., Jongman‐Sereno, K. P., Isherwood, J. C., Raimi, K. T., Deffler, S. A., & Hoyle, R. H. (2017). Cognitive and interpersonal features of intellectual humility. Personality and Social Psychology Bulletin, 43(6), 793–813. https://doi.org/10.1177/0146167217697695
McGuinness, K., Park, S., Lee, J., Lukamto, W., Fisher, C., Fulton, J., Haw, A., & Holland, K. (2025). Unpacking election misinformation: Australians’ experiences of news and information about the 2025 federal election. News & Media Research Centre, University of Canberra. https://doi.org/10.60836/hc77-gn54
Moore, R. C., Dahlke, R., & Hancock, J. T. (2023). Exposure to untrustworthy websites in the 2020 US election. Nature Human Behaviour, 7, 1096–1105. https://doi.org/10.1038/s41562-023-01564-2
Nielsen, R., & Graves, L. (2017). ‘News you don’t believe’: Audience perspectives on fake news. Reuters Institute for the Study of Journalism. https://ora.ox.ac.uk/objects/uuid:6eff4d14-bc72-404d-b78a-4c2573459ab8
Notley, T., Chambers, S., Park, S., & Dezuanni, M. (2024). Adult media literacy in Australia 2024: Australian attitudes, experiences and needs. Western Sydney University, Queensland University of Technology, and University of Canberra. https://doi.org/10.60836/n1a2-dv63
Osman, M., Adams, Z., Meder, B., Bechlivanidis, C., Verduga, O., & Strong, C. (2022). People’s understanding of the concept of misinformation. Journal of Risk Research, 25(10), 1239–1258. https://doi.org/10.1080/13669877.2022.2049623
Park, S., McGuinness, K., Fisher, C., Lee, J., K., McCallum, K., & Nolan, D. (2022). Digital news report: Australia 2022. News & Media Research Centre, University of Canberra. https://doi.org/10.25916/1xkk-jb37
Park, S., Notley, T., Thomson, T.J., Hourigan, A., and Dezuanni, M. (2024). Online misinformation in Australia: Adults’ experiences, abilities, and responses. News & Media Research Center, University of Canberra, and Western Sydney University. https://doi.org/10.60836/jpmm-dw04
Roozenbeek, J., & van der Linden, S. (2019). Fake news game confers psychological resistance against online misinformation. Palgrave Communications, 5, Article 65. https://doi.org/10.1057/s41599-019-0279-9
van Huijstee, D., Vermeulen, I., Kerkhof, P., & Droog, E. (2025). Combatting the persuasive effects of misinformation: Forewarning versus debunking revisited. New Media & Society, 0(0). https://doi.org/10.1177/1461444825135
Funding
This research was funded by the University of Canberra.
Competing Interests
The authors declare no competing interests.
Ethics
Human ethics was approved by the University of Canberra Human Ethics Committee (#14460).
Copyright
This is an open access article distributed under the terms of the Creative Commons Attribution License, which permits unrestricted use, distribution, and reproduction in any medium, provided that the original author and source are properly credited.
Data Availability
University of Canberra Human Ethics Committee restrictions do not allow further data sharing.